
 Home
Home News
News

- The bears are once more interfering with the ETC price as it moves through a strong rebound period on the daily price chart.
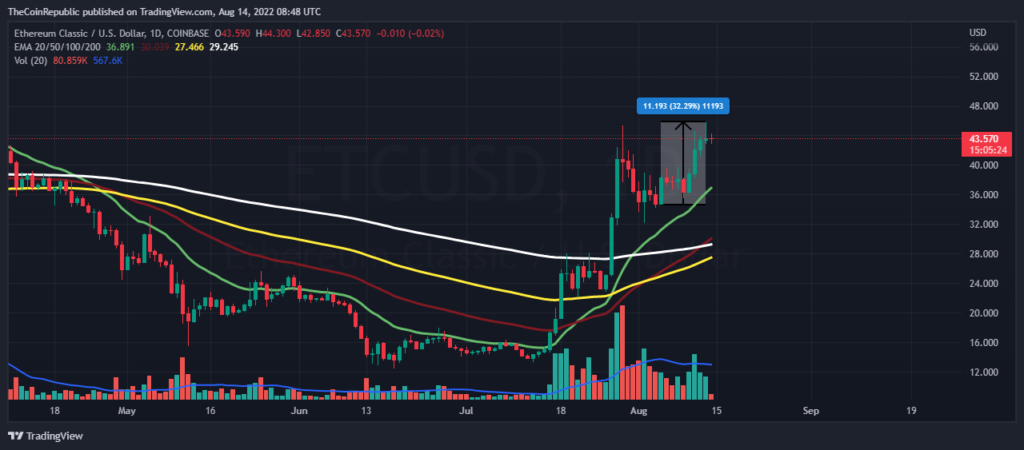
- The crypto asset is moving above the 20, 50, 100 and 200 days moving average.
- The ETC/BTC pair is at 0.001769 which is at a loss of 3.31% in it.
The ETC price moving on a great recovery phase is now again interrupted by the bears over the daily price chart. The coin needs to attract more buyers to overcome this dominance and continue the recovery process. A conspicuous recovery has occurred, but is not satisfactory for the investors as many of them are still facing losses.

The ETC price has recovered approx. 32% in 10 days and is now falling amid the selling pressure. The sellers are attracted by the recovering price, of which ETC bulls need to take care. A matter of concern for the bulls now is the sinking trading volume which needs to be healed or else the recovery efforts can be destroyed as the volume plays a major role in movement of price.

The current price for one ETC coin is hovering at 43.62 USD which is at a small loss of 2.13% in its market capitalization in the last 24 hrs. The coin has a trading volume of 984 million which is at a huge loss of 41.85% in the 24 hrs trading session and has a market cap of 5.9 billion. The volume market cap ratio is 0.1669.
Who will Win the Crown of Dominance?
Over the short term (4 hrs) chart we can observe a sideways movement as the bulls and bears are battling for dominance and none of them has taken over yet.
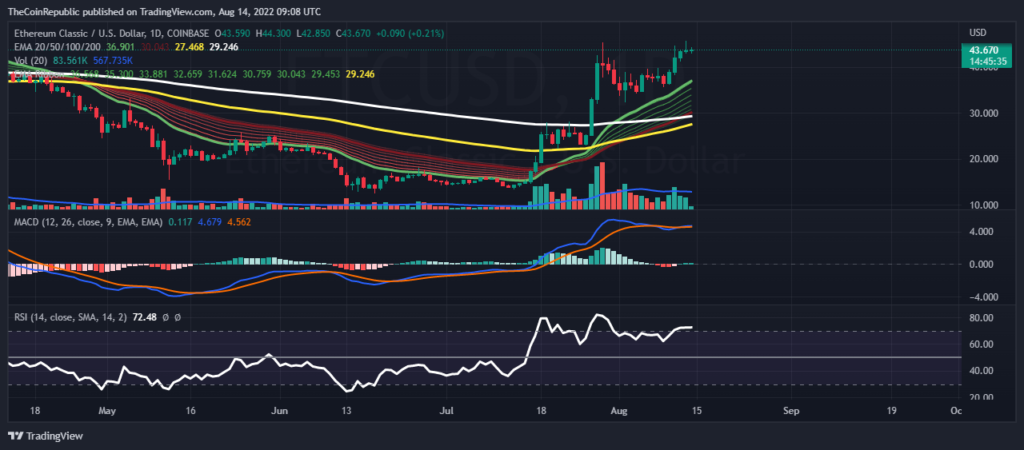
While observing the MACD indicator over the daily chart we can observe the sellers signal line is moving below the buyers line after the recent positive cross along with the histograms getting green. The relative strength index indicates an overbought from past 3 days which is the reason for activation of sellers. But analysts believe the potential of the coin and expect further growth. The RSI value is nearly equal to 72.5.
Conclusion
The ETC price moving on a great recovery phase is now again interrupted by the bears over the daily price chart. The ETC price has recovered approx. 32% in 10 days and is now falling amid the selling pressure. The recovering price is now attracting the sellers which can be the reason for the trend reversal. Whereas the investors need to wait as it is not the time to enter the market.
Technical levels
Resistance levels: $49 and $54.5
Support levels: $36.32 and $30.30
Disclaimer
The views and opinions stated by the author, or any people named in this article, are for informational ideas only, and they do not establish the financial, investment, or other advice. Investing in or trading crypto assets comes with a risk of financial loss.
Steve Anderson is an Australian crypto enthusiast. He is a specialist in management and trading for over 5 years. Steve has worked as a crypto trader, he loves learning about decentralisation, understanding the true potential of the blockchain.


