
 Home
Home News
News

- The bulls finally appear to have taken control of the daily price chart after moving in a pleasing advance.
- The increase in selling is bothering the investor which can be a consequence of BTC domination.
- The DOT/BTC pair is at 0.0003856 BTC which is merely at a gain of 0.20%.
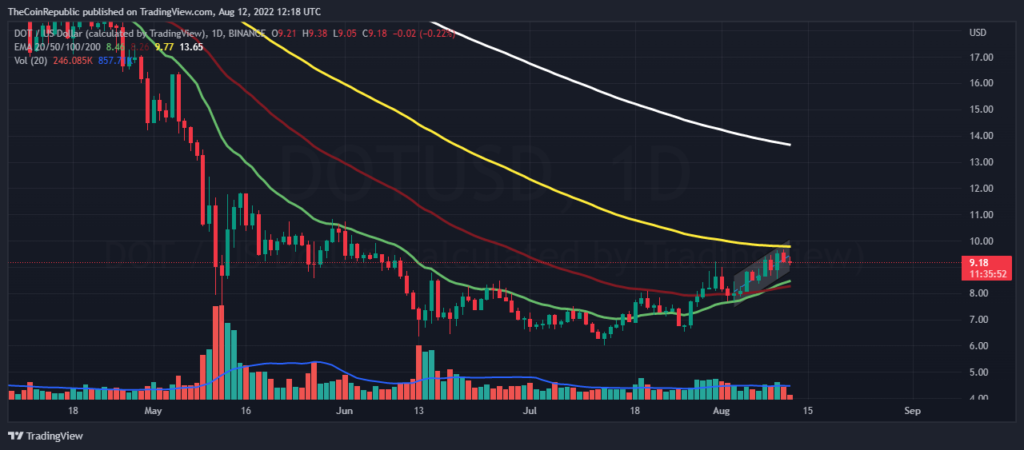
After moving on a flattering uptrend movement now it looks like the bulls finally took over the dominance, over the daily price chart. If these bearish efforts are not opposed now they can lead to the destruction of the recovery made by the DOT bulls. Analysts believe that if the bears made a breakdown the DOT price may fall to its all time low once again.

The DOT price needs its bulls to prevent this breakdown or else it can face a collapse, already the investors are facing huge losses which may cause a loss of interest in the coin. The coin still ranks #10 in the cryptocurrency even after a fall of more than 30% in its trading volume over the intraday trading session.

The current price for one DOT coin is hovering at $9.15 which is a loss of 3.06% in its market capitalization in the last 24 hrs. The coin has a trading volume of 602 million which is at a huge loss of 31.69% in the 24 hrs trading session and has a market cap of 10 billion. The volume market cap ratio is 0.06034.
What do DOTs’ Technical Indicators Suggest?
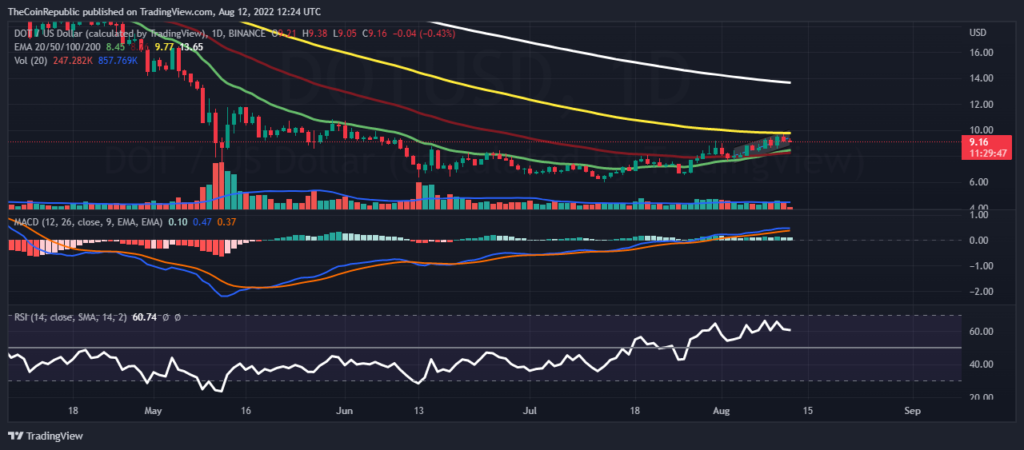
DOTs’ movement is highly connected to BTC and this can be one of the major reasons for the bearish empowerment over the daily and hourly price chart.
The MACD indicator shows the buyers line is moving above the sellers signal line over the daily price chart but the histograms are shrinking amid the increase in selling along the decrease in gap between the 2 lines. The relative strength index is displaying an increase in selling pressure that is making the RSI fall. The RSI value is nearly equal to 60.
Conclusion
After moving on a flattering uptrend movement now it looks like the bulls finally took over the dominance, over the daily price chart. The coin still ranks #10 in the cryptocurrency even after a fall of more than 30% in its trading volume. If breakdown takes place chances of price drop to all time low increases. One of the major reasons for this bearish empowerment is the bearish behaviour of BTC.
Technical levels
Resistance levels: $10.73 and $11.83
Support levels: $8.5 and $7.63
Disclaimer
The views and opinions stated by the author, or any people named in this article, are for informational ideas only, and they do not establish the financial, investment, or other advice. Investing in or trading crypto assets comes with a risk of financial loss.
Saurav Bhattacharjee is in charge of the Broadcast development team of The Coin Republic.
He has been covering the Metaverse and NFT niche for the past 2 years.
With stellar interviews on his portfolio like Nicehash, Paxful, WallstreetWolvesNFT, Bitholla, Totemfi, EOS.io etc. Saurav has spearheaded the NFT SUPERSTARS AWARD and successfully hosted the first award in 2021.


