
 Home
Home News
News

- Will the bulls resist the bearish dominance
- The current price of the coin is surfing around $9.47 and has grown by 1.99%
- The pair of DOT/BTC is trading at 0.000387 BTC
It seems that the bears are trying to enter the trade while the bulls bear bearish dominance. The price is approaching to follow the bearish trend the bull’s strategy is getting weaker. The downward momentum of the coins has become a matter of concern for investors. The bulls are seeking a window to take over the trade but the bears are pulling the legs of the bulls to bring the price to their desired zone. The bulls have to act fast so the DOT doesn’t lose its potential as the bearish trend has started the bulls may enter the trade and end the bearish trend.

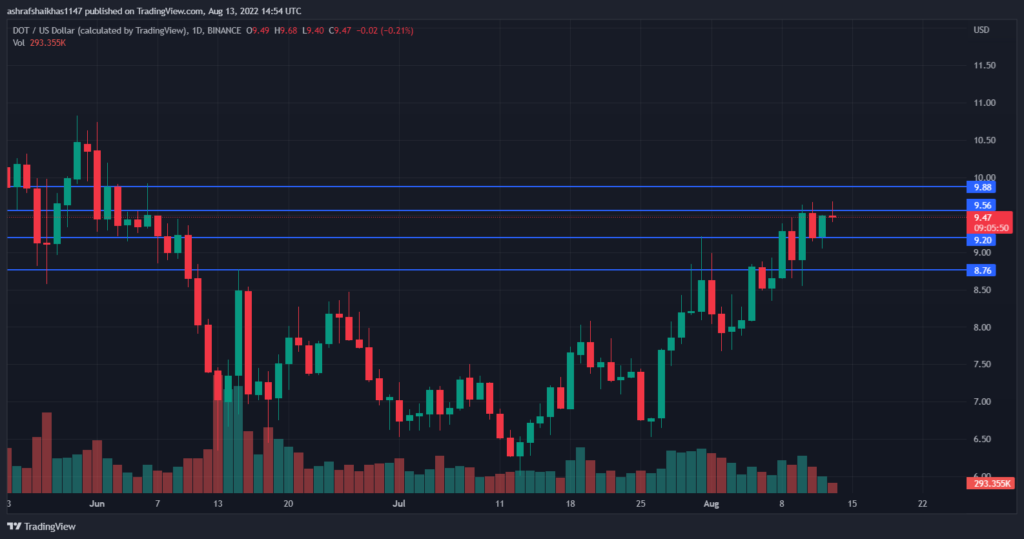
The current price of Polkadot is approx $9.47 with a total increase of 1.99% during the intraday trading session This might push the price up to the $9.56 primary resistance level and then break through to the $9.88 secondary resistance level. If the bulls grab the last straw then this will be a bite-to-dust to bulls by bears. If the bear somehow manages to step up to the plate then it will be a crisis for the bulls and the bulls will push themselves to their best and get the ball in their court and achieve their desired goals. This might cause the price to break through primary support of $9.20 and the stillness shown by the bulls in previous sessions remains the same after this victory the price may decline towards the secondary support of $8.76. Although it will be difficult for the bears to reach their desired targets.

There has been an approximate 25.22% drop in volume of Polkadot. The steady drop in volume shows that short-selling pressure has increased and buyers are exerting too much effort to raise the buying pressure. The bears have got engaged in trade and the bearish trend has got into action. The volume per market cap ratio is 0.04082.
Technical indicators’ projections for Polkadot
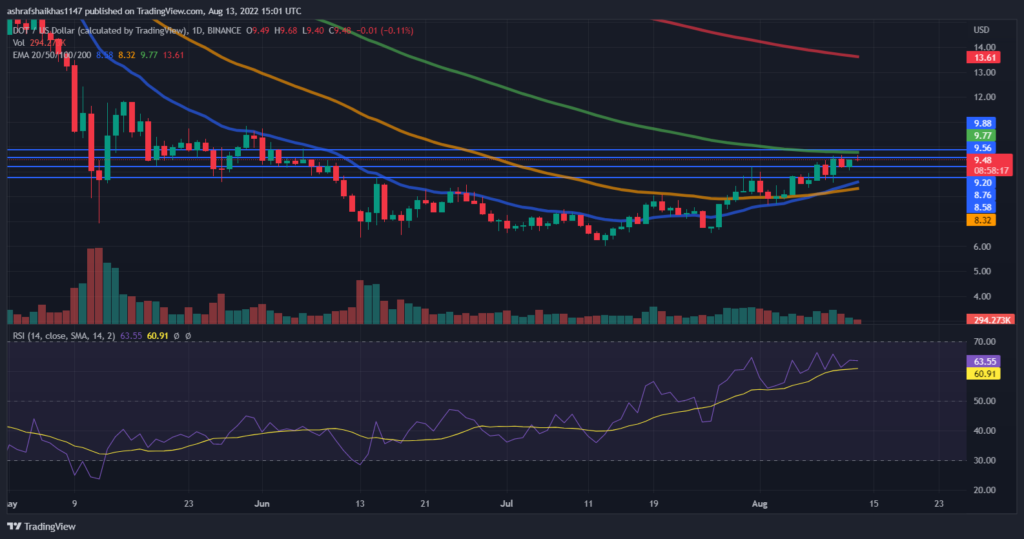
The technical indicator shows the following: The Relative Strength Index is approaching overbought territory. The bears must work hard to get the RSI back to neutrality However, bulls are taking advantage and pushing the RSI into the overbought zone. The current value of RSI is 63.87which is ahead of the average RSI which is 60.93. The price of the coin is still higher than the 20,50 Exponential Moving Average and is still lagging from the 100,200 Daily Moving Average
Technical Levels
Support Levels: $9.20and $8.76
Resistance Levels: $9.56 and $9.88
Disclaimer
The views and opinions stated by the author, or any people named in this article, are for informational ideas only. They do not establish financial, investment, or other advice. Investing in or trading crypto assets comes with a risk of financial loss.

Nancy J. Allen is a crypto enthusiast, with a major in macroeconomics and minor in business statistics. She believes that cryptocurrencies inspire people to be their own banks, and step aside from traditional monetary exchange systems. She is also intrigued by blockchain technology and its functioning. She frequently researches, and posts content on the top altcoins, their theoretical working principles and technical price predictions.


