
 Home
Home News
News

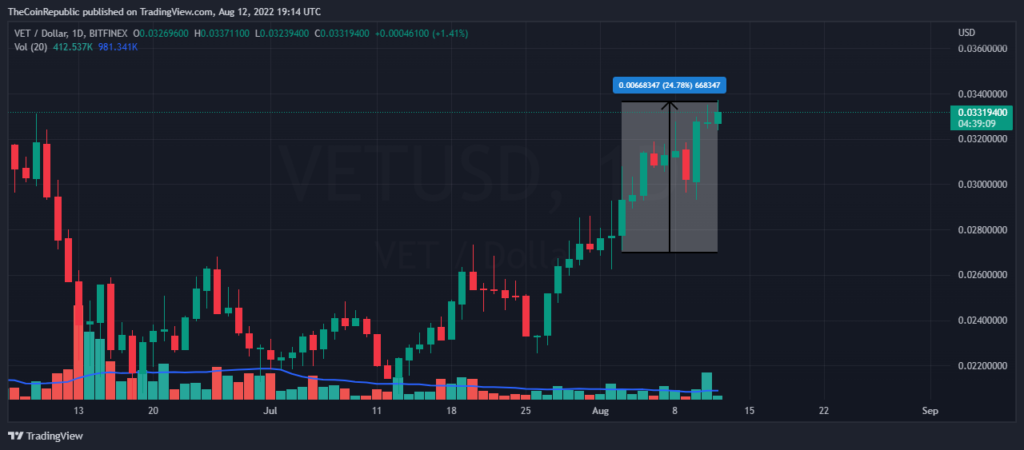
- Over the daily price chart, the VET price is heading strongly upward. The bulls are fiercely challenging the bears’ hold on the market, and it appears that the price is currently overbought.
- The technical indicators are showing the continuous increase in selling is drowning the price.
- The VET/BTC pair is at 0.00000137 BTC with a gain of 0.46%.
The VET price is moving at a strong uptrend movement over the daily price chart. The bulls are strongly opposing the bearish dominance and it looks like the price is now overbought. Getting over bought creates possibilities of dropping the price. This overbought price can attract many sellers and once the sellers are back the price will lose all the recovery efforts.

To save the recovery efforts, VET bulls need to be consistent and also need to focus over the trading volume. The trading volume is currently at a decrease of 19%. The VET price has recovered approx. 24% in 10 days though the recovery is not huge but a breath taking movement for the investors.

The current price for one VET coin is moving at $0.033 which is at an insignificant loss of 0.92% in its market capitalization in the last 24 hrs. The coin has a trading volume of 110 million which is at a conspicuous loss of 18.93% and has a market cap of 2.4 billion. The volume market cap ratio of 0.045.
Short-term View of VET
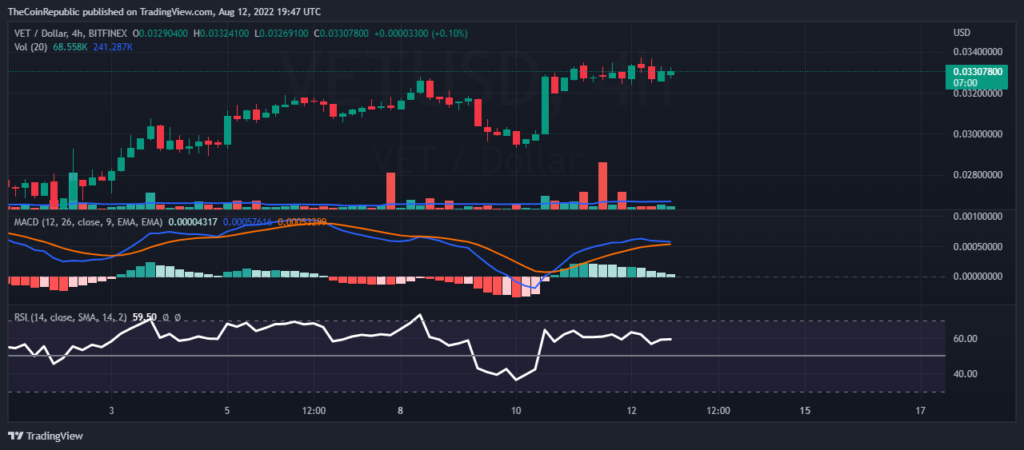
While analyzing the chart for a short term we can observe a sideways trend, this displays the battle between the bulls and bears. As the price is getting over sold the sellers are taking keen interest, but the continuous efforts of bulls are supporting the price.
The MACD over the hourly chart shows the buyers line is moving above the sellers signal line but as the sellers are participating actively a negative crossover can take place which is also indicated by the histograms. The relative strength index is moving netura showing the equality between buyers and sellers. The RSI value is nearly equal to 60.
Conclusion
The VET price is moving at a strong uptrend movement over the daily price chart. The bulls are strongly opposing the bearish dominance and it looks like the price is now overbought. The VET price has recovered approx. 24% in 10 days recovery is not huge but calming for the investors. While the short term analysis shows the sideways trend the indicators are showing the increase in selling.
Technical levels
Resistance levels: $0.035 and $0.043
Support levels: $0.029 and $0.026
Disclaimer
The views and opinions stated by the author, or any people named in this article, are for informational ideas only, and they do not establish the financial, investment, or other advice. Investing in or trading crypto assets comes with a risk of financial loss.

Nancy J. Allen is a crypto enthusiast, with a major in macroeconomics and minor in business statistics. She believes that cryptocurrencies inspire people to be their own banks, and step aside from traditional monetary exchange systems. She is also intrigued by blockchain technology and its functioning. She frequently researches, and posts content on the top altcoins, their theoretical working principles and technical price predictions.


