
 Home
Home News
News
- Bitcoin Cash price is trading above an upwards sloping line over the daily price chart.
- BCH crypto is still behind 20, 50, 100 and 200-days Daily Moving Average.
- The pair of BCH/BTC is at 0.005675 BTC with an intraday gain of 3.03%.
Over the daily price chart, the price of Bitcoin Cash is attempting to fly ahead with uptrend momentum. The token has been steadily positive for the past three trading sessions and is currently attempting to keep up the pace of the upswing as bears attempt to bring it back. For the token to maintain its present level above the upward-sloping line over the daily chart, BCH bulls must accumulate themselves. In order to stay in the recovery phase, BCH is attempting to keep itself above an upward sloping line. Bears might attempt to draw the token back, but bulls will have to step up to the plate to save the day.

The market capitalization of Bitcoin Cash increased by 2.67% from the previous day to $140.88. However, trade volume fell by 4.22% during the intraday trading session. This shows how determined BCH bulls are to stockpile so that the coin can start to keep the momentum of its climb. Volume to Market capitalization ratio is 0.1221.

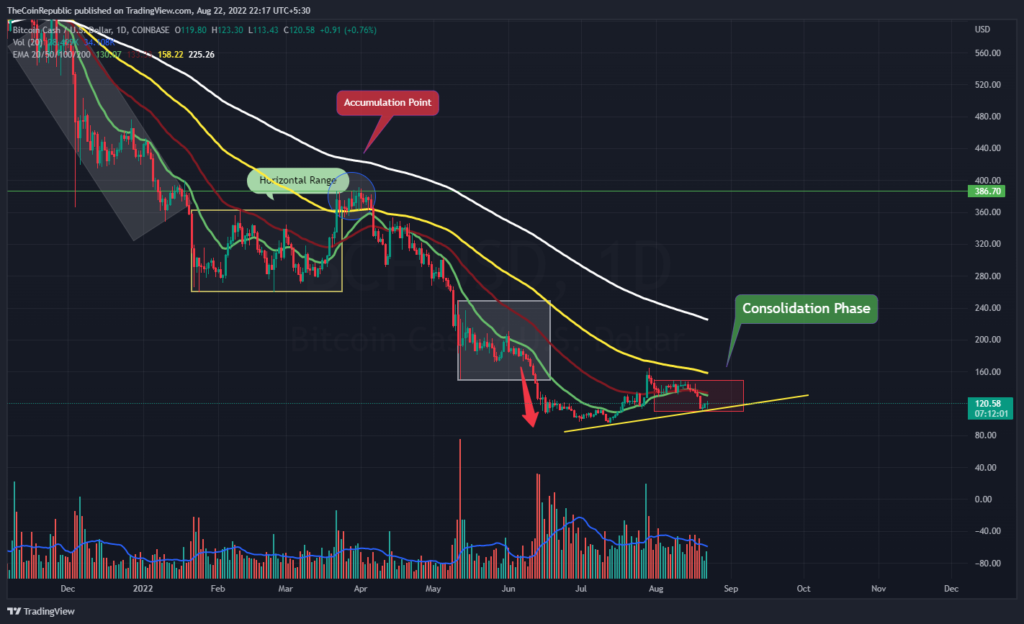
The price of the BCH coin is being driven by an intriguing pattern on the daily chart. During the recent months’ trading sessions, the token experienced a considerable decline. But this time, above an upward sloping line on the daily chart, BCH is attempting to begin its recovery phase. Bears, on the other hand, are attempting to drag the token below the sloped line in order to cause it to fall once more towards the lower levels. In the meantime, volume change is below average and must increase for BCH to continue.
Is it time for Pump or Dump for BCH Crypto?
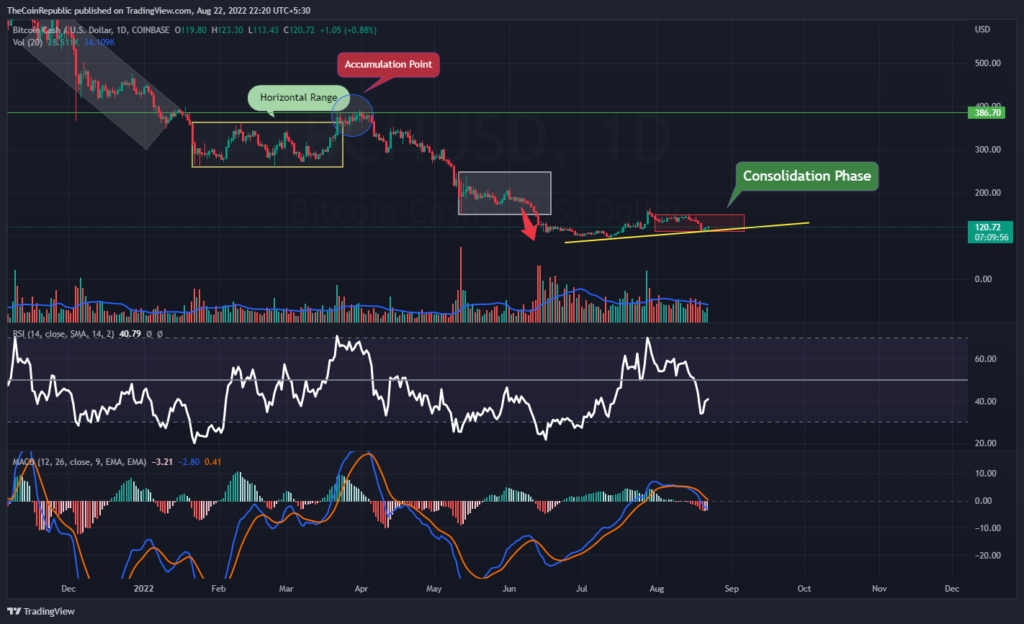
BCH coin price is trying to maintain itself above the upward sloping line over the daily price chart. The token must stay in the recovery phase to avoid falling over the daily chart. Technical indicators suggest the struggle of BCH bulls to sustain above the upward sloping line.
The BCH coin’s upward momentum is displayed by the Relative Strength Index (RSI). At 40, the RSI is moving in the direction of neutrality. The BCH coin’s sideways motion is visible on the MACD. The MACD line is waiting for any kind of crossover beneath the signal line. Investors in BCH must watch the daily chart for any directional changes.
Conclusion
Over the daily price chart, the price of Bitcoin Cash is attempting to fly ahead with uptrend momentum. The token has been steadily positive for the past three trading sessions and is currently attempting to keep up the pace of the upswing as bears attempt to bring it back. For the token to maintain its present level above the upward-sloping line over the daily chart, BCH bulls must accumulate themselves. In order to stay in the recovery phase, BCH is attempting to keep itself above an upward sloping line. In the meantime, volume change is below average and must increase for BCH to continue. Technical indicators suggest the struggle of BCH bulls to sustain above the upward sloping line. Investors in BCH must watch the daily chart for any directional changes.
Technical Levels
Support Level: $110.00 and $100.00
Resistance Level: $130.00 and $150.00
Disclaimer
The views and opinions stated by the author, or any people named in this article, are for informational ideas only, and they do not establish the financial, investment, or other advice. Investing in or trading crypto assets comes with a risk of financial loss.

Nancy J. Allen is a crypto enthusiast, with a major in macroeconomics and minor in business statistics. She believes that cryptocurrencies inspire people to be their own banks, and step aside from traditional monetary exchange systems. She is also intrigued by blockchain technology and its functioning. She frequently researches, and posts content on the top altcoins, their theoretical working principles and technical price predictions.


