
 Home
Home News
News

- Following a failed bullish attempt, the KAVA price is currently fighting a bearish pressure that is causing the price to decline over the daily price chart.
- The technical indicators behave a bit manipulative and questions the KAVA bulls for the reversal.
- The KAVA/BTC pair is at 0.00008271 BTC which is at a small loss of 0.69%.
The KAVA price after a bullish attempt is now again struggling with a bearish pressure which is making the price sink over the daily price chart. These shattering bullish efforts are a result of domination by the traditional cryptocurrency, Bitcoin. It behaves bearishly and makes the whole crypto market suffer.

Though the BTC bulls are trying to take over the situation, efforts are not appropriate to take the ball to their court. So the token needs to keep attracting the buyers in order to pump the price, or else if the situation persists the token may suffer a collapse soon. While talking about the trading volume, it is at a good gain which can be a relieving news for the KAVA investors. If KAVA bulls make some consistent efforts they can easily take over the market as believed by the analysts, watching the current situation.

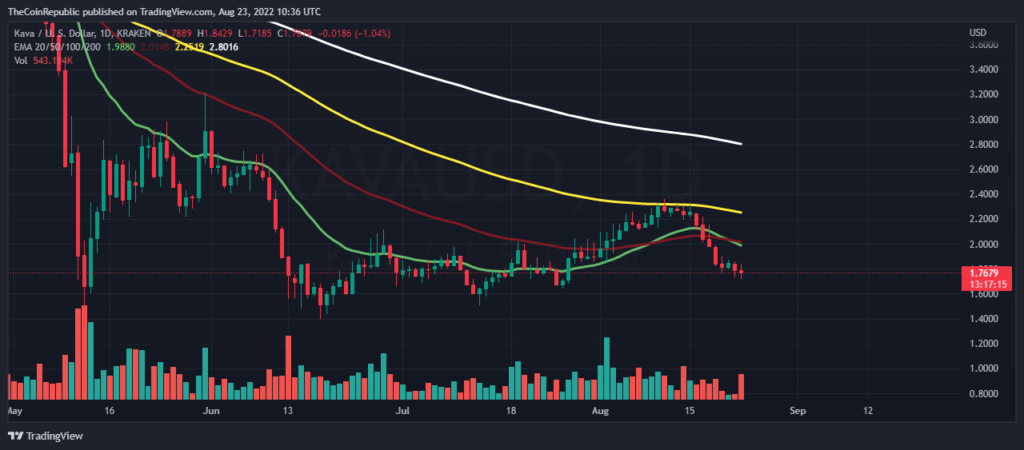
The current price for one KAVA token is hovering at $1.77 which is at a very small loss of 0.27% in its market capitalization in the last 24 hrs. The coin has a trading volume of 26 million which is at a huge gain of 47% in the 24 hrs trading session and has a market cap of 443 million. The volume market cap ratio is 0.05992.
Can KAVA Bulls Make a Reversal?
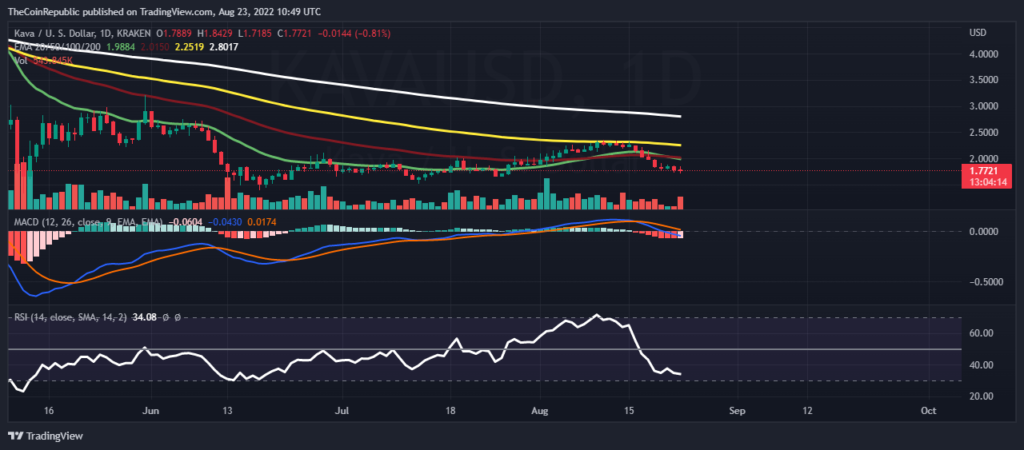
We can observe a wave pattern of downtrend movement over the hourly price chart and a negative cross over the multiple EMAs can also be observed over the daily chart.
The MACD indicator over the daily chart shows the sellers signal line is moving above the buyers line but the bullsh efforts are visible over the fading red histograms. The relative strength index still indicates the selling pressure over the chart and if the situation persists it will cross the oversold soon. The RSI value is moving below 35.
Conclusion
The KAVA price after a bullish attempt is now again struggling with a bearish pressure which is making the price sink over the daily price chart. So the token needs to keep attracting the buyers in order to pump the price, or else if the situation persists the token may suffer a collapse soon. While looking over the technical indicators we can observe it looks difficult for the token to make a rebound now as the selling pressure has not decreased yet.
Technical levels
Resistance levels: $2 and $2.11
Support levels: $1.64 and $1.60
Disclaimer
The views and opinions stated by the author, or any people named in this article, are for informational ideas only, and they do not establish the financial, investment, or other advice. Investing in or trading crypto assets comes with a risk of financial loss.
Steve Anderson is an Australian crypto enthusiast. He is a specialist in management and trading for over 5 years. Steve has worked as a crypto trader, he loves learning about decentralisation, understanding the true potential of the blockchain.


