
 Home
Home News
News
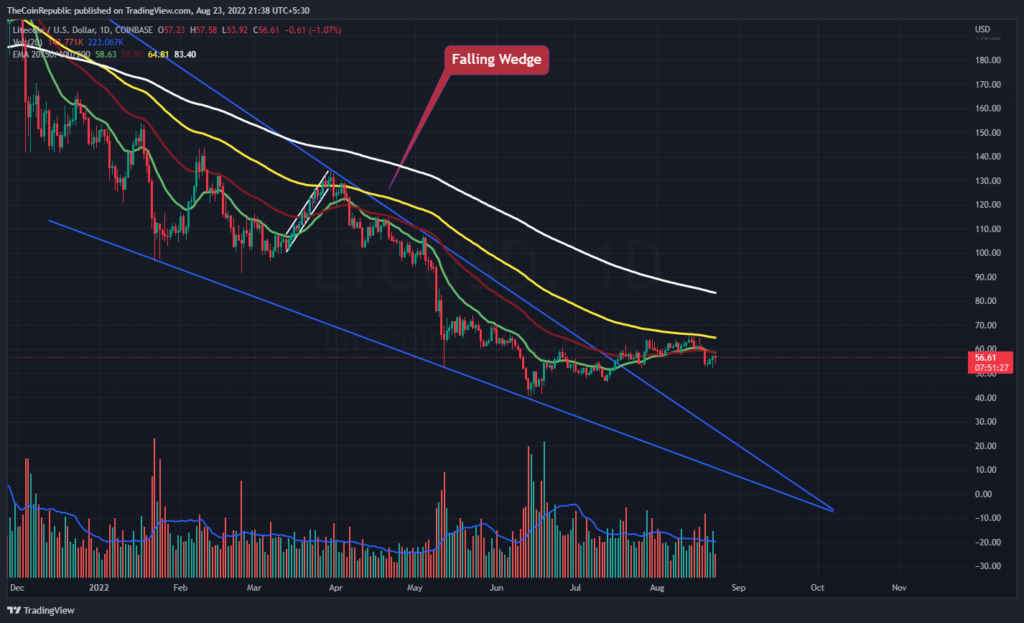
- On the daily price chart, the Litecoin price is attempting to climb back above the falling wedge pattern.
- Cryptocurrency LTC is currently trading below the 20, 50, 100, and 200-day Daily Moving Averages.
- The pair of LTC/BTC is at 0.002638 BTC with an intraday drop of 1.13%.
Over the daily price chart, the price of Litecoin has been decreasing into a wedge-shaped pattern. Bulls on LTC tried to hold their position at the top trendline of the chart to get out of the falling pattern. With slowly increasing momentum, the token is moving once more in the direction of the top trendline. This time, the bulls will need to gather in order to see the token breakout. Bears are also attempting to change the momentum of the token’s gain by pushing LTC back towards the lower trendline. For the token to breakout, LTC investors must wait until LTC bulls maintain their position at the upper trendline’s edge.

At the present CMP price, Litecoin’s market capitalization has decreased by 0.80% during the past day to $56.61. In the course of intraday trading, the number of trades fell by 16.81%. Bulls must advance since they have a little stockpile in order to maintain the steady price increase of the LTC coin. The market cap to volume ratio is 0.1429.

The price of LTC is seeking to break out of its downward trend on the daily price chart. However, if bulls want LTC to soar, they must increase their own accumulation because their own accumulation is subpar. LTC needs to improve on its currently subpar volume shift in order to successfully break out of the pattern.
What do Technical Indicators suggest about LTC?
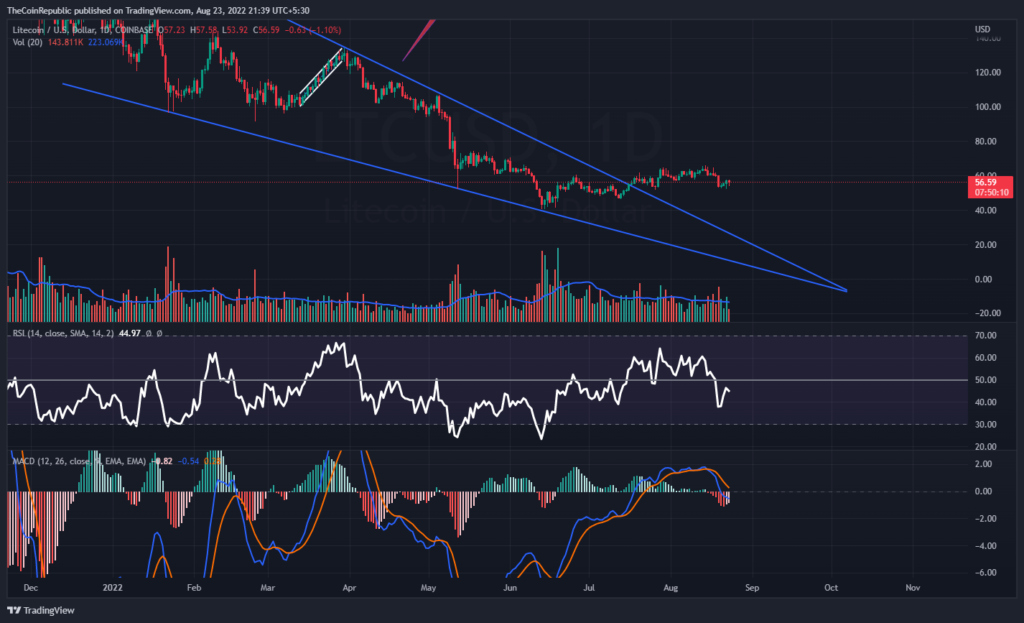
On the daily price chart, the LTC coin price is attempting to climb toward the upper trendline. Inside the collapsing wedge, the token is attempting to rebound. To stop the falling pattern, the coin must form bulls. Technical signs point to the momentum of the negative trend for LTC.
The momentum of the LTC coin’s fall is highlighted by the Relative Strength Index. At 44, the RSI is about to go below neutrality. On MACD, the downward momentum of the LTC coin can be detected. The MACD line is lower than the signal line following a negative crossover. Investors in LTC must monitor the daily price chart for any shifts in trend.
Conclusion
Over the daily price chart, the price of Litecoin has been decreasing into a wedge-shaped pattern. Bulls on LTC tried to hold their position at the top trendline of the chart to get out of the falling pattern. With slowly increasing momentum, the token is moving once more in the direction of the top trendline. This time, the bulls will need to gather in order to see the token breakout. Bears are also attempting to change the momentum of the token’s gain by pushing LTC back towards the lower trendline. LTC needs to improve on its currently subpar volume shift in order to successfully break out of the pattern. Technical signs point to the momentum of the negative trend for LTC. The MACD line is lower than the signal line following a negative crossover. Investors in LTC must monitor the daily price chart for any shifts in trend.
Technical Levels
Support Levels: $50.00 and $47.00
Resistance Levels: $60.00 and $65.00
Disclaimer
The views and opinions stated by the author, or any people named in this article, are for informational ideas only, and they do not establish the financial, investment, or other advice. Investing in or trading crypto assets comes with a risk of financial loss.
Steve Anderson is an Australian crypto enthusiast. He is a specialist in management and trading for over 5 years. Steve has worked as a crypto trader, he loves learning about decentralisation, understanding the true potential of the blockchain.


