
 Home
Home News
News

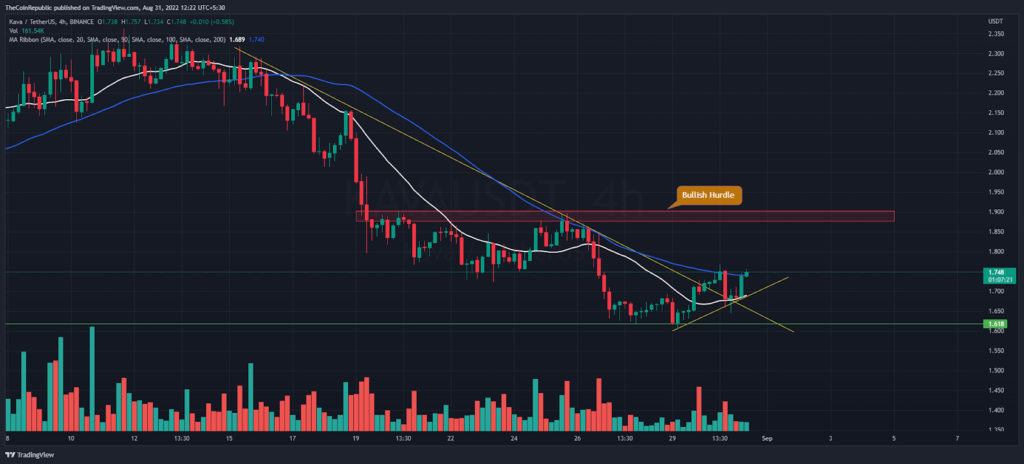
- Kava price trades above the ascending trendline between retracement phases.
- Buyers are attempting to push the KAVA price above the 50-day moving average on the 4-hours price scale.
- Kava token with a bitcoin pair is neutral at 0.00009646 satoshis.
The KAVA token appears to be bullish in the intraday trading session as the bulls reversed the price action to the higher side. The 4-hours price chart is showing a high-low formation above an ascending trendline (yellow) since its weekly low.

On the lower time frame, buyers broke the bearish trend line last night. Moreover, the bulls have completed the retracement phase and now the bulls are aiming to push the asset price towards the $2.0 resistance area. Meanwhile, the KAVA token is trading at the $1.76 mark at press time against USDT.

Last night was volatile as the daily price candle outperformed the Doji candle. Later, the bulls are about to break the previous swing high. As a result, the market capitalization reached above $440 million, up 1.4% over the past 24 hours according to CMC. Furthermore, the Kava token with the bitcoin pair is neutral at 0.00009646 satoshis.
Trading volumes remained neutral last night due to the fall. Nevertheless, buyers are attempting to push the KAVA price above the 50 day moving average on the 4-hours price scale. On the other hand, Kava is trading below the 20 and 50 DMAs under the daily price graph.
KAVA Draws Higher-lows Formation on Daily Price Scale
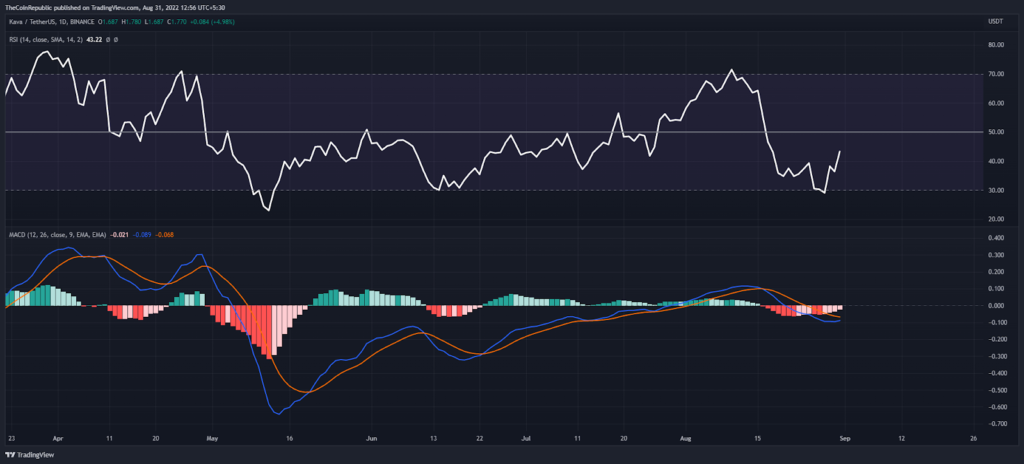
The daily RSI is above the 40-mark and has moved into the no trading zone. Buyers above the 50-mark may be more aggressive for a bullish trend. Conversely, MACD moves below the neutral zone in terms of the daily price scale,
Conclusion
The KAVA token is still trading above the previous swing low, which shows that the bulls are still active in the correction phase. Buyers are attempting to push the KAVA price above the 50 day SMA on the 4-hours price scale. This bullish signal could take the price trend towards the $2.0 mark.
Support level – $1.6 and $1.4
Resistance level – $2.0 and $3.0
Disclaimer
The views and opinions stated by the author, or any people named in this article, are for informational ideas only, and they do not establish the financial, investment, or other advice. Investing in or trading crypto assets comes with a risk of financial loss.

Nancy J. Allen is a crypto enthusiast, with a major in macroeconomics and minor in business statistics. She believes that cryptocurrencies inspire people to be their own banks, and step aside from traditional monetary exchange systems. She is also intrigued by blockchain technology and its functioning. She frequently researches, and posts content on the top altcoins, their theoretical working principles and technical price predictions.


