
 Home
Home News
News

- Kusama price is trying to break out from the consolidation phase over the daily price chart.
- KSM Crypto is trading below 20, 50, 100a nd 200-days Daily Moving Average.
- The pair of KSM/BTC is at 0.002392 BTC with an intraday gain of 3.06%.
On the daily chart, KSM price is presently struggling to maintain its current position while maintaining a sharp downward trend. One Kusuma coin has always priced anything between $55.00 and $70.00. The coin is currently trading below the lower range of the consolidation phase as a result of being caught by short sellers. KSM crypto needs to get away from short-sellers in order to prevent falling drastically below the lower range of the consolidation period.

After dramatically increasing 5.29% of its market value over the previous 24 hours, the Kusama price is currently CMP at $48.65. The trade volume fell by 1.78% during the intraday trading session. This demonstrates that despite the token’s diminishing value, it is still thriving to maintain its present level. Volume to market cap ratio is 0.04282.

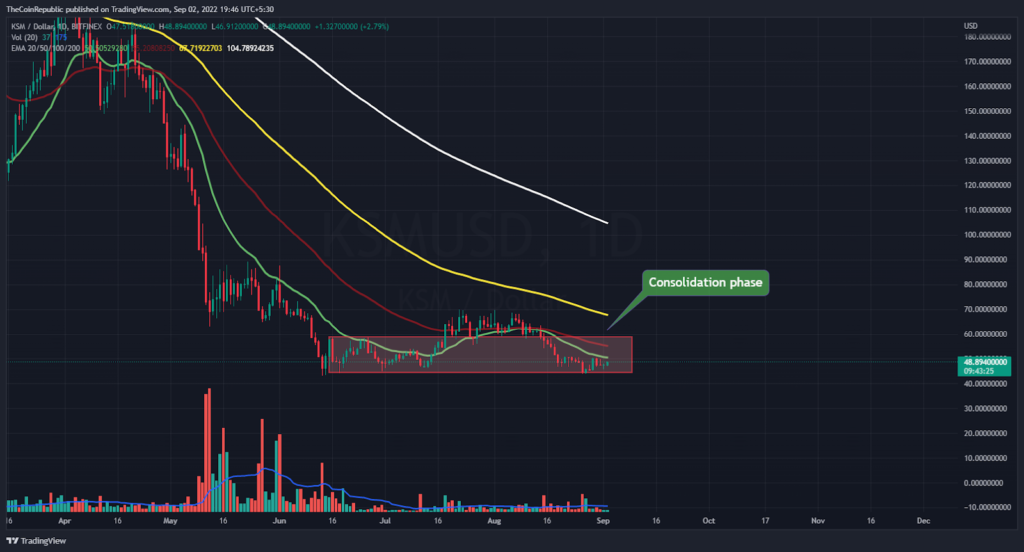
The price of the KSM coin must maintain this level in order to remain above the consolidation period. The volume bars show that bears are currently in control of the KSM currency market. Bulls must utilize every ounce of their strength to control volume and keep KSM in its position because the volume change is still below average. KSM Crypto is trading below 20, 50, 100a nd 200-days Daily Moving Average.
What do Technical Indicators suggest about KSM?
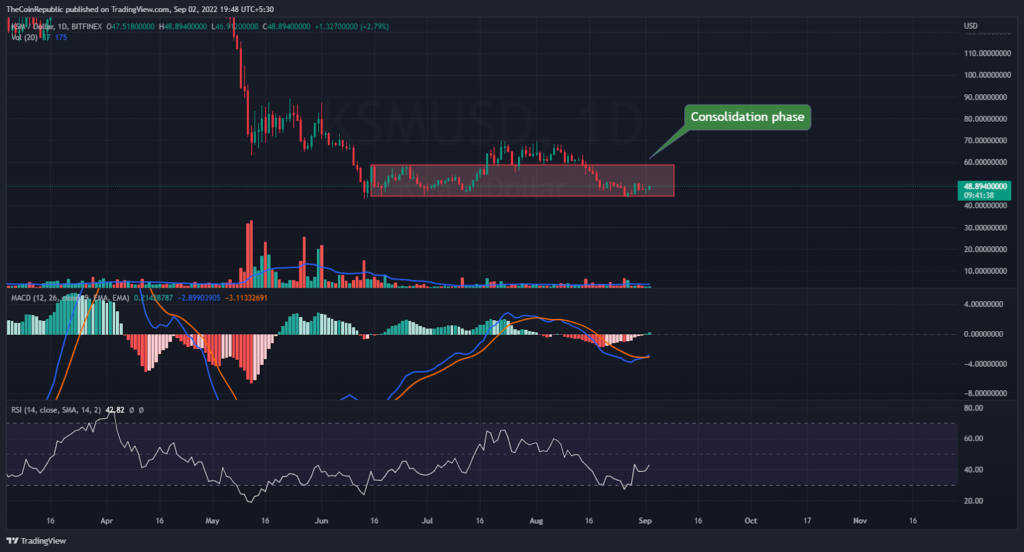
The price of the KSM coin needs to hold above the lower price range of the consolidation phase in order to prevent a significant decrease on the daily chart. Technical indications show that the KSM currency is trending upward.
The upstream motion of the KSM coin is clearly visible using the Relative Strength Index. The RSI, which is at 42 right now, is set to cross the neutrality line. The MACD shows the upward momentum of the KSM coin. The MACD line is above the signal line following a positive crossover. Investors in KSM must keep an eye on the daily chart for any changes in trend.
Conclusion
On the daily chart, Kusama price is presently struggling to maintain its current position while maintaining a sharp downward trend. One KSM coin has always priced anything between $55.00 and $70.00. The coin is currently trading below the lower range of the consolidation phase as a result of being caught by short sellers. The volume bars show that bears are currently in control of the KSM currency market. Bulls must utilize every ounce of their strength to control volume and keep KSM in its position because the volume change is still below average. Technical indications show that the KSM currency is trending upward.
The MACD shows the upward momentum of the KSM coin. The MACD line is above the signal line following a positive crossover. Investors in KSM must keep an eye on the daily chart for any changes in trend.
Technical Levels
Support Levels: $45.00 and $40.00
Resistance Levels: $50.00 and $60.00
Disclaimer
The views and opinions stated by the author, or any people named in this article, are for informational ideas only, and they do not establish the financial, investment, or other advice. Investing in or trading crypto assets comes with a risk of financial loss.

Andrew is a blockchain developer who developed his interest in cryptocurrencies while pursuing his post-graduation major in blockchain development. He is a keen observer of details and shares his passion for writing, along with coding. His backend knowledge about blockchain helps him give a unique perspective to his writing skills, and a reliable craft at explaining the concepts such as blockchain programming, languages and token minting. He also frequently shares technical details and performance indicators of ICOs and IDOs.


