
 Home
Home News
News

- The DASH coin price is trading at the supply zone on a daily time frame.
- The DASH coin price is trading in a small range, after falling to the demand zone.
- The pair of DASH/BTC is trading at the price level of 0.002316 with an increase of 0.96% in the past 24 hours.
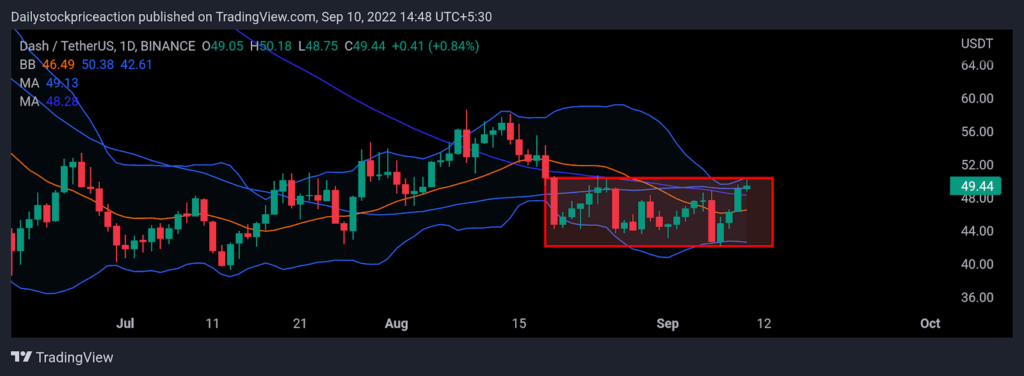
The DASH coin price is trading at the demand zone on a weekly time frame. As per the price action, the token price has bounced off the demand zone indicating a small range and trading at the supply zone on a daily time frame. The DASH coin price is making lower low and lower high formation on a weekly time frame. At present, the DASH coin price is bearish as seen on a daily time frame. The recent fall in the global markets has affected the DASH coin price but not much as it has managed to sustain above the demand zone. The recent bounce in the price of the DASH coin was strong as it formed a bullish chart pattern. The DASH coin price is trading below the 50 and 100 MAs. The recent fall in the price of the DASH coin price led to the breakdown of the important MAs. Moving upwards the coin price can be seen facing strong rejection from these MAs. Currently, the coin price is trading at the upper band of the Bollinger band indicator. Volumes have increased as the coin price showed bullish momentum in the past couple of days.

The DASH coin price is trading in a small range on the daily time frame
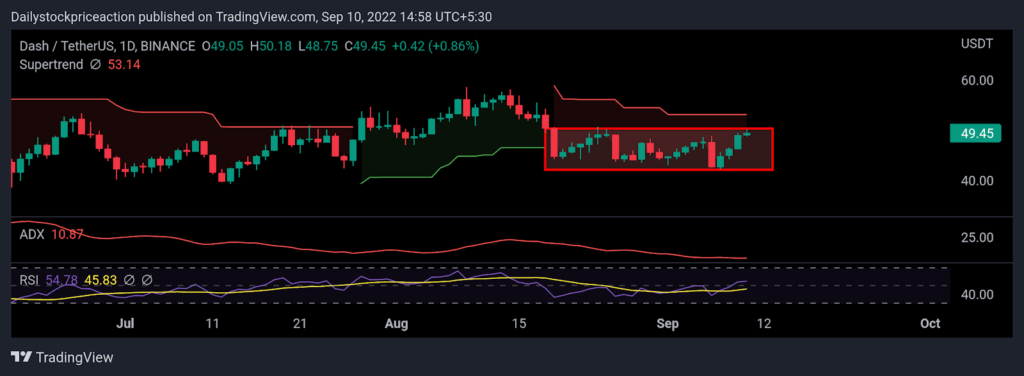
Average Convergence Divergence: The ADX curve has been dipping for the past couple of weeks. The recent fall in the price of DASH coin price has led to the ADX curve falling below the 20 mark. The coin price is consolidating as the ADX curve loses strength. If the bulls fail to overpower the bears and push the coin price up then the coin price can be seen falling. If the coin price breaks the supply zone and starts moving upwards the ADX curve can be seen moving upwards supporting the trend.

Supertrend: Supertrend indicator is negative as the coin price broke the important long-term demand zone on the lower timeframe. Since then the coin price has started moving down rapidly. As of now, the coin price has broken the super trend buy line which has triggered a sell line. Moving upwards the super trend sell line can act as a strong supply zone.
Relative Strength Index: RSI curve is trading at the price of 53.39 as the coin bounces off the demand zone. At present, the RSI curve has crossed the 20 SMA. The coin is forming higher low and higher high formation on a 1-hour time frame as the coin shows bullishness in the higher time frame. The DASH coin price can be seen moving up if it sustains at the supply zone and if it does then the RSI curve can be seen moving even higher up supporting the trend. Once the RSI curve crosses the halfway mark of 50, the DASH coin price can be seen moving up quickly.
CONCLUSION: The DASH coin price is bullish as seen in a lower time frame. Price action suggests the same, but on a larger time frame, the coin is still in bearish mode. The technical parameters are bearish as the coin price broke the important demand zone. It remains to see if the DASH coin price will bounce off the demand zone on a larger time frame or fails to do so and break further below.
SUPPORT: $44.00 and $46.00
RESISTANCE: $51.00 and $57.00
Disclaimer
The views and opinions stated by the author, or any people named in this article, are for informational ideas only, and they do not establish financial, investment, or other advice. Investing in or trading crypto assets comes with a risk of financial loss.

With a background in journalism, Ritika Sharma has worked with many reputed media firms focusing on general news such as politics and crime. She joined The Coin Republic as a reporter for crypto, and found a great passion for cryptocurrency, Web3, NFTs and other digital assets. She spends a lot of time researching and delving deeper into these concepts around the clock, and is a strong advocate for women in STEM.


