
 Home
Home News
News

- Loopring price has been consolidating after breaking down from the rising wedge pattern over the daily price chart.
- LRC crypto is trading at 20 EMA and is still below 50, 100 and 200-days Daily Moving Average.
- The pair of LRC/BTC is at 0.00001703 BTC with an intraday drop of 0.01%.
The loopring price is going back from the top trendline of the rising wedge pattern over the daily price chart in a downward trend. The token needs to maintain the rising wedge pattern in order to move forward into its recovery phase. The token must continue in its recovery phase within the rising pattern. Nevertheless, bears are aiming to seize the token that short-sellers are holding. More buyers are required for LRC cryptocurrency to trade inside the rising wedge formation. LRC investors must wait until the cryptocurrency’s daily price chart begins to rise.

In the last day, the price of Loopring, which is currently valued at $0.36, has grown 1.32% of its market value. The trading volume of the LRC currency decreased by 23.39% during intraday trading. This demonstrates that LRC currency bears are trying to push the token lower. Volume to market cap ratio is 0.1077.

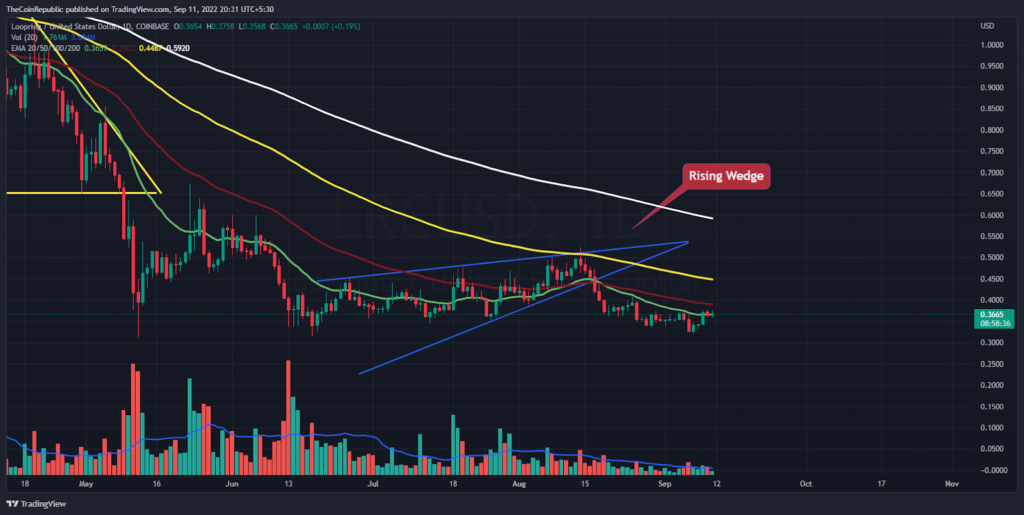
After dropping below the distribution level of the consolidation phase inside the rising wedge, the price of the LRC coin is now seeking assistance from buyers. In order to stop the upward momentum and return to the higher level prior to the rising wedge formation, the coin has to get support from buyers. It can be shown that the volume change was bear-influenced and below normal. In order for the token to start its recovery phase, LRC bulls must pile up.
What do Technical Indicators suggest about LRC?
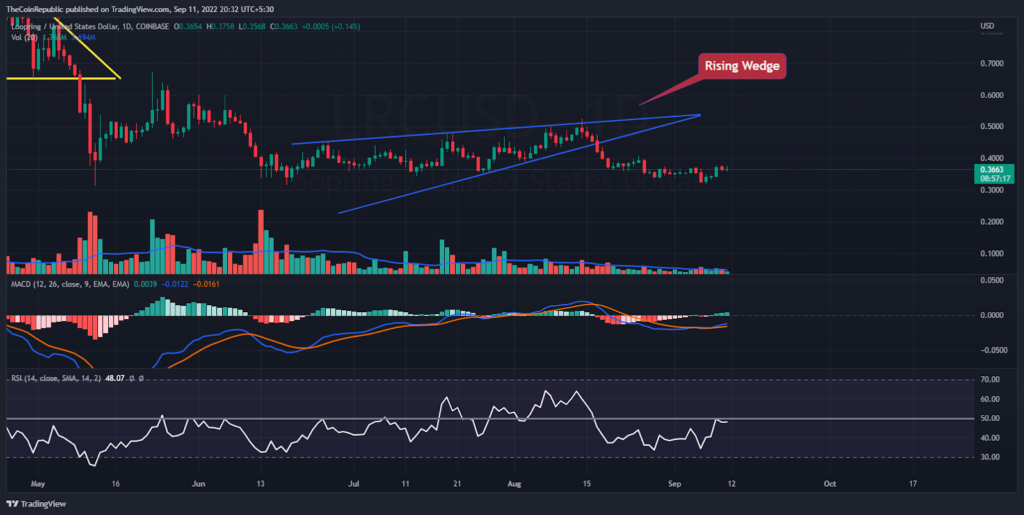
The price of the LRC cryptocurrency must break through the rising wedge formation’s bottom trendline in order to recover. To beat the daily chart, the coin still has to draw in a sizable number of buyers. Technical indicators reveal how far the LRC currency has fallen.
The relative strength index (RSI) shows the LRC cryptocurrency’s rate of decline. The RSI is edging closer to neutrality at 61. The MACD shows the downward velocity of the LRC coin. Despite being above the signal line, the MACD line finds it difficult to catch up. LRC investors need to keep an eye on the daily chart for any changes in trend.
Conclusion
The loopring price is going back from the top trendline of the rising wedge pattern over the daily price chart in a downward trend. The token needs to maintain the rising wedge pattern in order to move forward into its recovery phase. The token must continue in its recovery phase within the rising pattern. Nevertheless, bears are aiming to seize the token that short-sellers are holding. More buyers are required for LRC cryptocurrency to trade inside the rising wedge formation. It can be shown that the volume change was bear-influenced and below normal. In order for the token to start its recovery phase, LRC bulls must pile up. Technical indicators reveal how far the LRC currency has fallen. Despite being above the signal line, the MACD line finds it difficult to catch up. LRC investors need to keep an eye on the daily chart for any changes in trend.
Technical levels
Support Levels: $0.32 and $0.30
Resistance Levels: $0.40 and $0.50
Disclaimer
The views and opinions stated by the author, or any people named in this article, are for informational ideas only, and they do not establish the financial, investment, or other advice. Investing in or trading crypto assets comes with a risk of financial loss.
Steve Anderson is an Australian crypto enthusiast. He is a specialist in management and trading for over 5 years. Steve has worked as a crypto trader, he loves learning about decentralisation, understanding the true potential of the blockchain.


