
 Home
Home News
News

- The AMP token price is trading below the long-term demand zone on a daily time frame.
- The AMP token price broke the descending triangle pattern on a daily time frame.
- The pair of AMP/BTC is trading at the price level of 0.0000025 with a decrease of -6.45% in the past 24 hours.
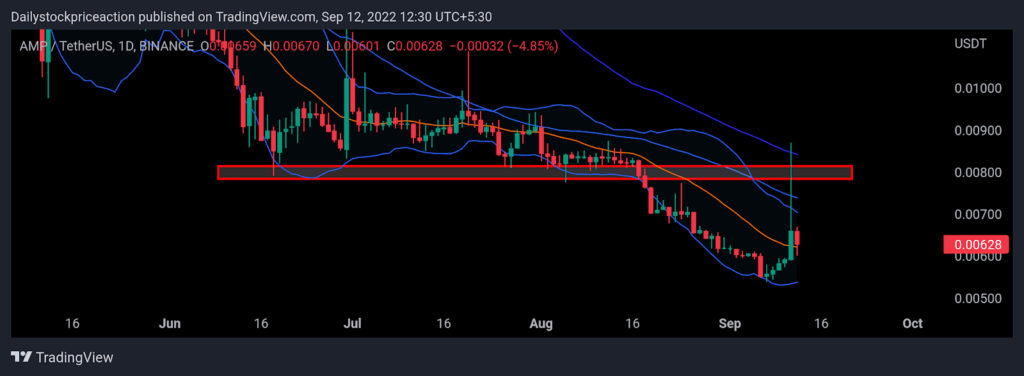
The AMP token price as per the price action is trading below the demand zone on a daily time frame. The token price recently fell below the demand zone on a daily time frame and since then the token price is continuously falling. After the breaking of the supply zone, the AMP token price tried to recover but failed to do so. The token price from a long rejection week of the supply zone. The AMP token price is forming a lower low and lower high price structure daily. The AMP token price is hovering below the supply zone, as it continues to move in the bearish trajectory. At present, the token price is trading below the 50 and 10o MAs. Moving toward the token price can be seen as facing strong rejection from these MAs. The recent fall in the AMP token price led to the breakdown of the important 50 and 100 MAs. Currently, the AMP token price is trading at the lower band of the Bollinger band indicator after failing to surpass the upper band. The token price has also fallen below 14 MA. Volumes have increased as the token price fell.

The AMP token price is in a strong bear grip and the technical parameters suggest the same
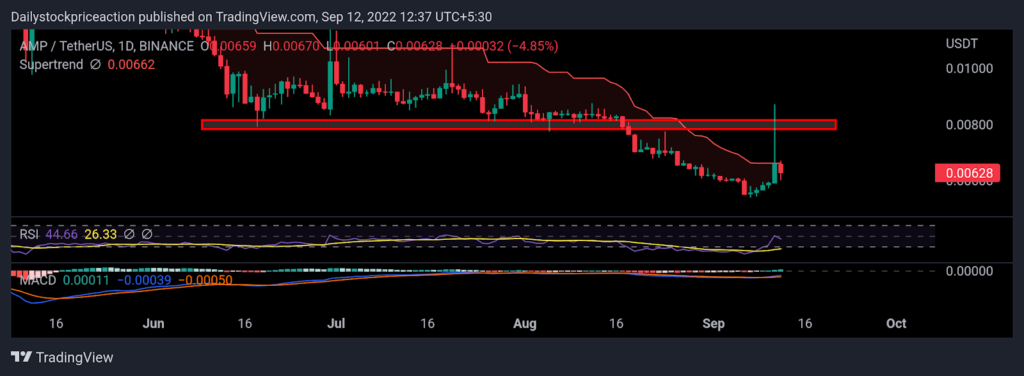
Supertrend: The AMP token price has turned bearish as it failed to surpass the supply zone forming a strong bearish candlestick pattern on a daily time frame. Recent bearishness resulted in the AMP token price falling below the important short-term demand zone. Previously the AMP token price was resting on the super trend buy line. As the token price fell, the super trend indicator triggered a sell signal. As of now, the AMP token price is trading below the super trend sell line, and moving upwards the token price can be seen facing rejections off the super trend line.

Moving Average Convergence Divergence: Recent breakdown in the price of AMP tokens seems real as the MACD indicator has triggered a negative crossover. The orange line crossed the blue line on the downside indicating bearish momentum in the upcoming days. If the token price can sustain above the current short-term demand zone, then the MACD indicator can be seen to turn positive. If the AMP token price fails to hold the current price levels and falls below the demand zone, the MACD line can be seen widening supporting the breakdown.
CONCLUSION: The AMP token price is bearish as per the price action. The AMP has given a breakdown of a bearish chart pattern. As the token fell from the supply zone, the technical parameters also turned negative. It remains to see if the bulls can push the token price up from the demand zone, or if bears take control and push the price down.
SUPPORT: $0.055 and $0.0057
RESISTANCE: $0.0080 and $0.0088
Steve Anderson is an Australian crypto enthusiast. He is a specialist in management and trading for over 5 years. Steve has worked as a crypto trader, he loves learning about decentralisation, understanding the true potential of the blockchain.


