
 Home
Home News
News

- The XLM token price is hovering around the supply zone on a daily time frame.
- The XLM token price is forming a demanding triangle pattern on a daily time frame.
- The pair of XLM/BTC is trading at the price level of 0.0000056 with a decrease of -0.10% in the past 24 hours.
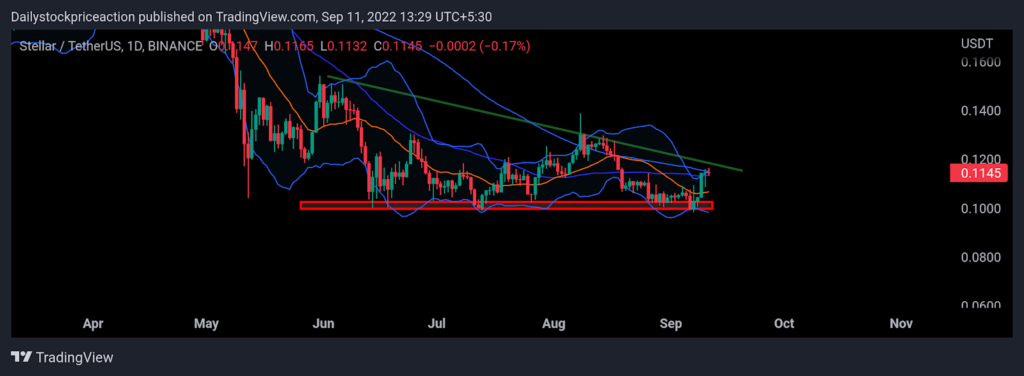
The XLM token price is trading at the supply zone on a daily time frame after bouncing off the demand zone strongly. The token price bounced off the demand zone with a strong bullish pressure as it formed a bullish candlestick pattern. The XLM token price is forming lower low and lower high price formation on a daily time frame. While on a smaller time frame the token price is forming higher high and higher low formation. The token price despite the bearishness prevailing in the global market has managed to bounce off the demand zone. The XLM token price has been on a rise for the past 72 hours. At present, the XLM token price is trading below the 50 and 100 MAs. Moving upwards the token price can be seen facing strong bearish pressure of the supply zone. Bearishness in the price of the token led to it falling below the 50 and 100 MAs. The token price is currently trading at the upper band of the Bollinger band indicator. Volumes have increased causing the volatility to increase therefore investors should remain cautious and wait for a clear trend.

The XLM token price is forming a descending triangle pattern on a daily time frame
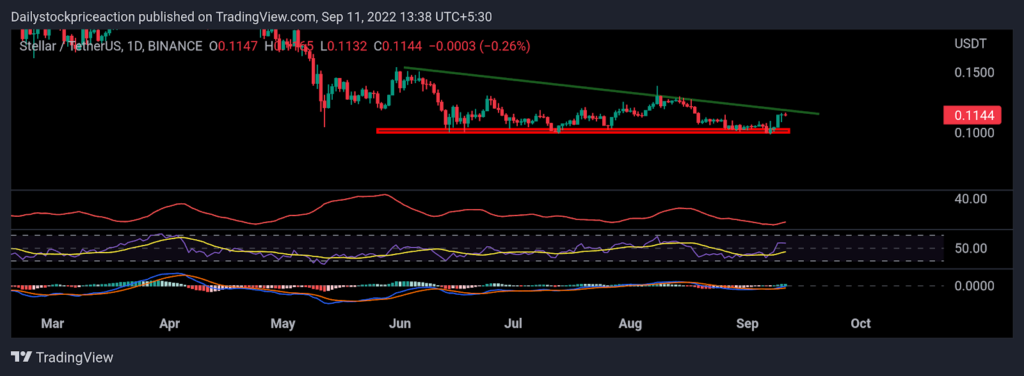
Moving Average Convergence Divergence: MACD indicator has given a positive crossover as the token gave a breakout of the supply zone. The blue line crossed the orange line on the upside. This has resulted in the token price moving up strongly. Recently the XLM token price fell after the breakout of small resistance, as a result, the MACD indicator also depicted the same. Once the token price starts moving up again after breaking the supply zone, the gap between the blue and orange lines can be seen widening supporting the trend.

Average Directional Movement Index: ADX curve is moving downwards since the token price fell to the demand zone. Since then the ADX curve has not turned upwards. Currently, the ADX curve has slipped below the 20 mark. As of now, the ADX curve has turned sideways indicating a possible halt in the price movement and change in price structure after the breakout.
Relative Strength Index: The RSI curve is transacting at 45.67 as the token price hovers at the supply zone. The RSI curve is yet to cross the halfway mark of 50. Once the token price breaks the supply zone, the RSI curve can be seen moving upwards crossing the halfway mark of 50. Although the token price has shown a massive movement in the demand zone, consolidating before further moves are bound to happen. The RSI curve has crossed the 20 EMA indicating bullishness for the upcoming training days.
CONCLUSION: The XLM token price is trading at the supply zone, as per the price action. The XLM token price is forming a bearish chart pattern on a daily time frame. If the token price is successfully able to break out of the supply zone, it can be seen moving higher. However, investors should remain cautious and wait for a clear trend before taking any action.
SUPPORT: $0.10 and $0.11
RESISTANCE: $0.140 and $0.190

Nancy J. Allen is a crypto enthusiast, with a major in macroeconomics and minor in business statistics. She believes that cryptocurrencies inspire people to be their own banks, and step aside from traditional monetary exchange systems. She is also intrigued by blockchain technology and its functioning. She frequently researches, and posts content on the top altcoins, their theoretical working principles and technical price predictions.


