
 Home
Home News
News

- Helium price is trading with strong downtrend momentum over the daily price chart.
- HNT crypto slipped below 20, 50, 100 and 200-days Daily Moving Average.
- The pair of HNT/BTC is at 0.0002017 BTC with an intraday drop of 6.62%.
Helium price is currently trading with strong bearish momentum and is facing strong selling pressure during the intraday trading session. HNT crypto needs to attract more buyers in order to escape the range it has been trading in since August 2022. HNT coin price must accumulate buyers in order to push the token upwards over the daily chart. HNT at first fell through a descending parallel channel and got stuck inside the descending triangle after consolidating for a while then token got rejected from the pattern and has been trying to gather support since then. HNT investors need to wait until HNT coin price action leaves the price range of $5.75 and $3.35.

The CMP price of Helium is currently $4.06, down 6.75% from yesterday. During the intraday trading session, the transaction volume also fell by 46.57%. It shows the bears’ efforts to bring the token down from its peak range. Volume to market cap ratio is 0.03764.

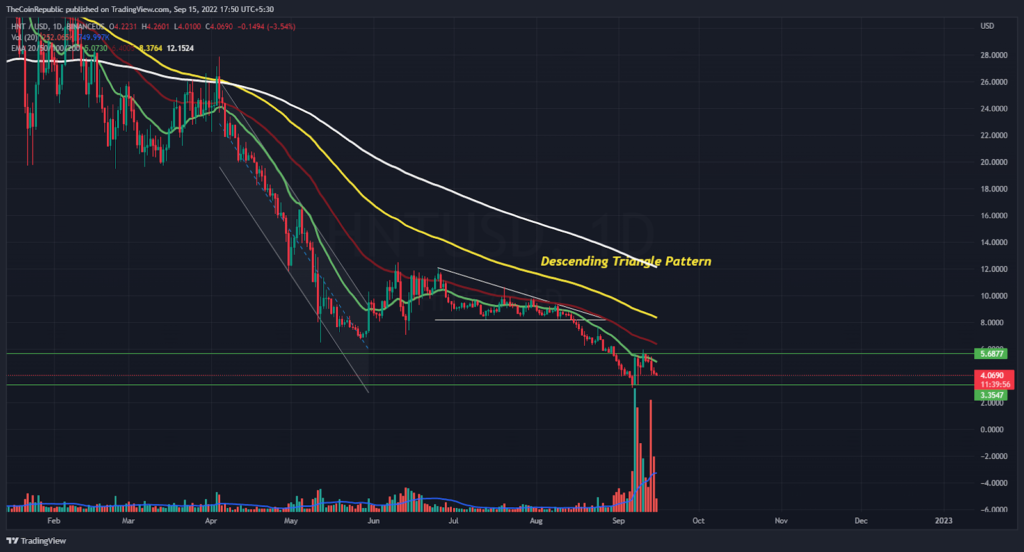
The price of the HNT coin must get support from the bulls in order to remain in the higher range of the consolidation phase. When the token gets close to the top level of the consolidation phase, short selling pressure can start to build. The volume change needs to increase for HNT to go to the consolidation stage as it is currently below average. Meanwhile, HNT crypto slipped below 20, 50, 100 and 200-days Daily Moving Average.
Technical Indicators Showcases the Strong Downtrend Velocity of HNT!
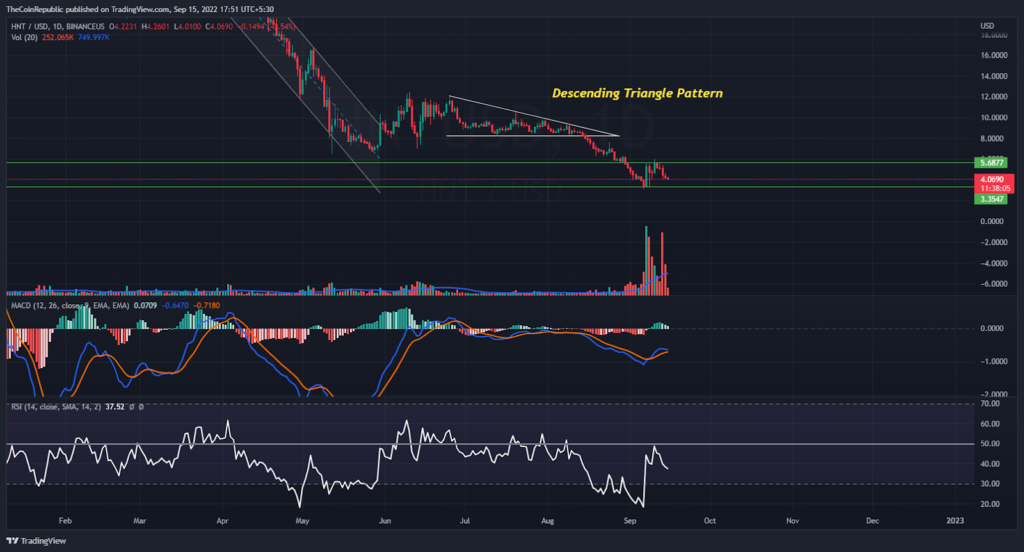
The price of HNT coins is clearly trending lower on the daily price chart. The momentum of the HNT coin’s drop is shown by technical indicators. The relative strength index shows the HNT coin’s downward motion. The RSI is approaching oversold territory at 37. The HNT currency has a bearish momentum, according to the MACD. A negative crossover between the MACD line and the signal line is about to occur. Investors in HNT must wait until bulls have accumulated before the token may be saved.
Conclusion
Helium price is currently trading with strong bearish momentum and is facing strong selling pressure during the intraday trading session. HNT crypto needs to attract more buyers in order to escape the range it has been trading in since August 2022. HNT coin price must accumulate buyers in order to push the token upwards over the daily chart. HNT at first fell through a descending parallel channel and got stuck inside the descending triangle after consolidating for a while then token got rejected from the pattern and has been trying to gather support since then. The volume change needs to increase for HNT to go to the consolidation stage as it is currently below average. Technical indicators display the HNT coin’s descent’s momentum. HNT investors need to wait till bullsaccumulate for the rescue of the token.
Technical Levels
Support Level: $3.70 and $3.40
Resistance Level: $5.00 and $5.65
Disclaimer
The views and opinions stated by the author, or any people named in this article, are for informational ideas only, and they do not establish the financial, investment, or other advice. Investing in or trading crypto assets comes with a risk of financial loss.

With a background in journalism, Ritika Sharma has worked with many reputed media firms focusing on general news such as politics and crime. She joined The Coin Republic as a reporter for crypto, and found a great passion for cryptocurrency, Web3, NFTs and other digital assets. She spends a lot of time researching and delving deeper into these concepts around the clock, and is a strong advocate for women in STEM.


