
 Home
Home News
News

- Holo price got stuck inside the horizontal range-bound area over the daily price chart.
- The pair of HOT/BTC is at 0.0000001068 BTC with an intraday gain of 1.51%.
- HOT crypto is trading at 20 EMA and is still below 50, 100, and 200-day Daily Moving Average.
Since June 21, the price of Holo has been steady inside the area defined by a horizontal range. The token has been trying to break out of the consolidation phase, but bulls have repeatedly failed to hold gains at the level of the consolidation phase. The bullish stance of HOT suggests that they are this time concentrating on recording the token’s breakthrough from the horizontal zone. However, the token’s price has remained constant between $0.0019 to $0.0024. The price of HOT is currently strongly going upward and rising into the top range of the consolidation phase. To enable the token to move above the caged area, HOT bulls must maintain their position at the trendline.

The estimated price of Holo is currently $0.00213, while the previous day saw an increase in the market value of 2.21%. But during the intraday trading session, the number of trades rose by 3.80%. This may indicate that bulls are making more of an effort to accumulate for the price rebound of HOT cryptocurrency. The volume to market cap ratio is 0.05926.

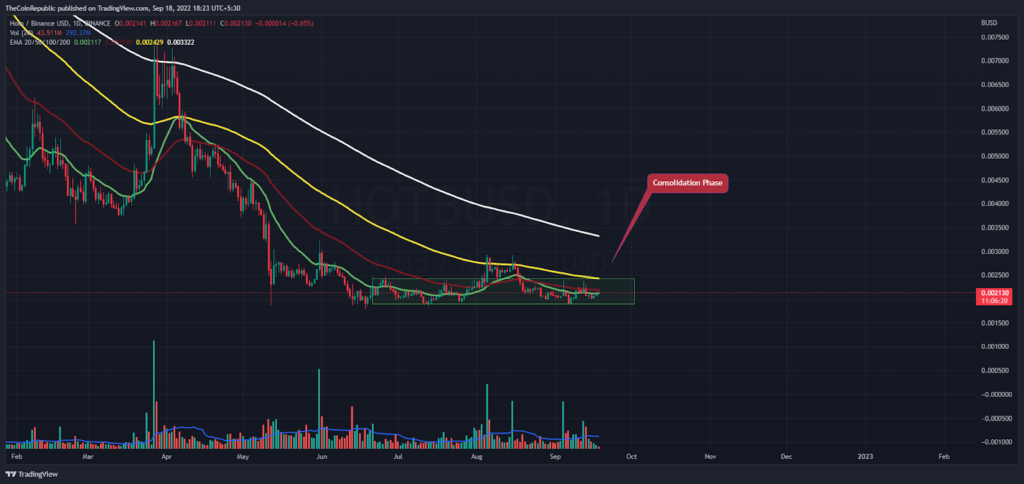
On the daily price chart for HOT, the price is moving upward toward the upper trendline of the consolidation phase. To see the breakout of the token, bulls must gather at HOT. Bears, however, could at any time halt the HOT coin’s upward momentum because volume shows that the rate of accumulation is slow. Bulls in HOT must act quickly to buy if they don’t want to get caught in any bearish traps.
What do Technical Indicators suggest about HOT?
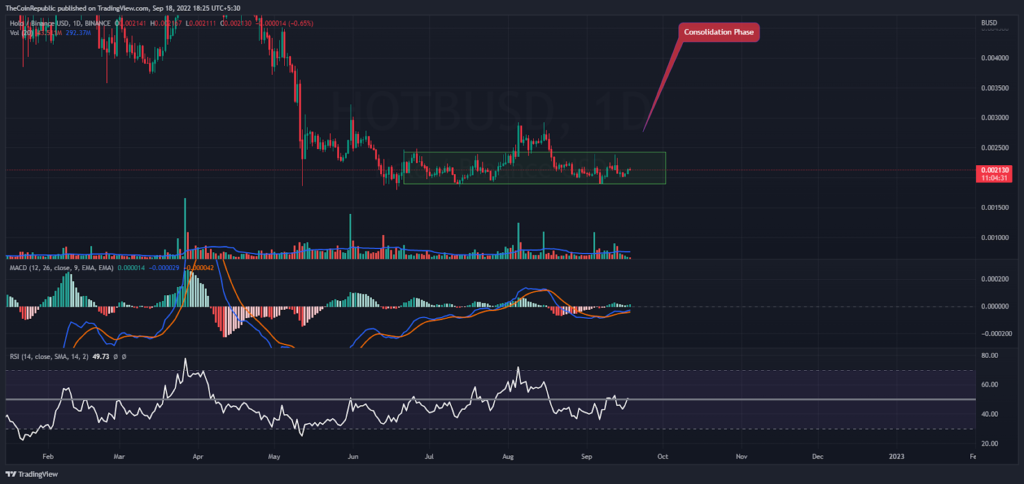
During the consolidation stage on the daily chart, the HOT currency price is attempting to hold at the present level. Technical indicators reveal the increasing velocity of the HOT coin.
The HOT coin’s relative strength index clearly shows the strength of the rise. At 49, the RSI is just above neutrality. The consolidation phase of the HOT coin is visible on the MACD. The signal line is below the MACD line. Investors in HOT must watch the daily chart for any directional changes.
Conclusion
Since June 21, the price of Holo has been steady inside the area defined by a horizontal range. The token has been trying to break out of the consolidation phase, but bulls have repeatedly failed to hold gains at the level of the consolidation phase. The bullish stance of HOT suggests that they are this time concentrating on recording the token’s breakthrough from the horizontal zone. However, the token’s price has remained constant between $0.0019 to $0.0024. The price of HOT is currently strongly going upward and rising into the top range of the consolidation phase. Bulls in HOT must act quickly to buy if they don’t want to get caught in any bearish traps. Technical indicators reveal the increasing velocity of the HOT coin.
Technical Levels
Support Levels: $0.0020 and $0.0018
Resistance Levels: $0.0022 and $0.0024
Disclaimer
The views and opinions stated by the author, or any people named in this article, are for informational ideas only, and they do not establish any financial, investment, or other advice. Investing in or trading crypto assets comes with a risk of financial loss.

Nancy J. Allen is a crypto enthusiast, with a major in macroeconomics and minor in business statistics. She believes that cryptocurrencies inspire people to be their own banks, and step aside from traditional monetary exchange systems. She is also intrigued by blockchain technology and its functioning. She frequently researches, and posts content on the top altcoins, their theoretical working principles and technical price predictions.


