
 Home
Home News
News

- Will the harmony survive such volatile market
- The Harmony has lost approx 6.96% in the intraday trading session
- The pair of ONE/BTC is at 0.0000001039 BTC with rise of 1.33%
The Harmony is facing such a volatile market this unpredictable changes could bring the ONE ’s potential down. The coin could barely survive in such circumstances and this will bring new hurdles for the investors to make any further. Over a long period of time ONE is facing such fluctuating price the drastic movement of the price of the ONE over the daily price chart could make whales move and that could be a turning point for the Harmony and could bring new hopes to the investors

The current price of Harmony is at $0.02118 and the total drop in price of ONE in the last 24-hours is 6.96% which is an indication of a bearish trend.The bears seem to enter the trade. This may lead the price to reach primary support of $0.01878, if the bull’s calmness from earlier sessions holds, the price may drop towards the secondary support of $0.01792. If the bulls could make it upto the plate .This might lead to a price breakthrough the primary resistance of $0.02308 and this price could break up to the secondary resistance of $0.03001. The investors are eagerly waiting for any directional change over the price of the coin.

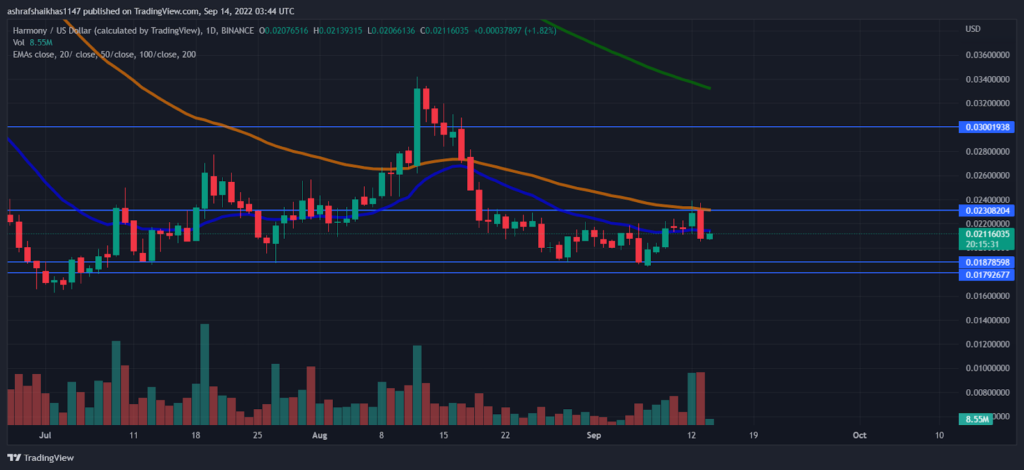
The volume of the One has decreased by approx 25.81% this implies that short selling pressure is increasing. Let us check who will dominate ONE bulls or bears. The volume to market cap ratio of ONE is 0.1955 . The Harmony is lagging behind by the 20,50,100,200 Daily moving average.The 20 day and 50 day exponential moving average were on urge to converge we have to wait for any directional movement over the daily price chart
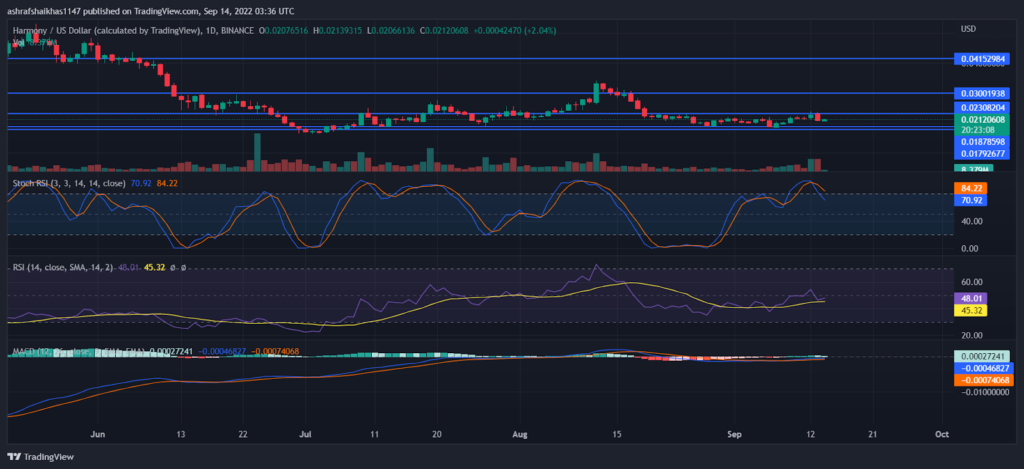
The technical indicator shows the following: The MACD and MACD signal have collapsed indicating the positive cross. The Relative Strength Index is approaching oversold territory. The buyers must work hard to get the RSI back to normal. However, bears are taking advantage and pushing the RSI into the oversold zone. The current value of RSI is 48.73 which is below the average RSI that is 45.37. The stoch RSI has driven to the overbought zone the current Stoch RSI is 70.87 which below The average Stoch RSI of 84.20 this indicates that the buying may increase.
Conclusion
The current price of Harmony is at $0.02118 and the total drop in price of ONE in the last 24-hours is 6.96%.The pair of ONE/BTC is at 0.0000001039 BTC with rise of 1.33%.The volume of the One has decreased by approx 25.81%. The Harmony is lagging behind by the 20,50,100,200 Daily moving average. The current value of RSI is 48.73 which is below the average RSI that is 45.37. The current Stoch RSI is 70.87 which below The average Stoch RSI of 84.20
Technical Levels
Support Levels: $$0.01878 and $$0.01792
Resistance Levels: $0.02308 and $0.03001
Disclaimer
The views and opinions stated by the author, or any people named in this article, are for informational ideas only. They do not establish the financial, investment, or other advice. Investing in or trading crypto assets comes with a risk of financial loss.

Andrew is a blockchain developer who developed his interest in cryptocurrencies while pursuing his post-graduation major in blockchain development. He is a keen observer of details and shares his passion for writing, along with coding. His backend knowledge about blockchain helps him give a unique perspective to his writing skills, and a reliable craft at explaining the concepts such as blockchain programming, languages and token minting. He also frequently shares technical details and performance indicators of ICOs and IDOs.


