
 Home
Home News
News

- Celsius price struggles to get back inside the rising parallel channel over the daily price chart.
- CEL crypto is currently trading at 20, 50 and 100-days DMA but still below 200-days DMA.
- The pair of CEL/BTC is at 0.0000758 BTC with an intraday gain of 0.49%.
On the daily price chart, the price of Celsius is attempting to climb via an upward channel. The coin is currently gaining as it climbs near the channel’s top trendline. If the CEL coin is to bounce back and achieve a respectable resistance level, it must maintain the momentum of the recent uptrend. For the token to be able to break free of the ascending parallel channel with a powerful bullish surge, CEL bulls must keep the upward momentum going. Bears are attempting to short the CEL market, though. It is difficult for cryptocurrencies like CEL to successfully recover in a bear market. Investors in CEL must hold off until bulls maintain their position at the ascending parallel’s upper trendline.

The Celsius price is presently approximated at $1.45 and has gained 4.50% of its market capitalization in the last 24-hour period. Trading volume has decreased by 15.30% in the intraday trading session. This shows that bears are trying to register the token’s breakdown from the rising parallel channel over the daily chart. Volume to market cap ratio is 0.04432.

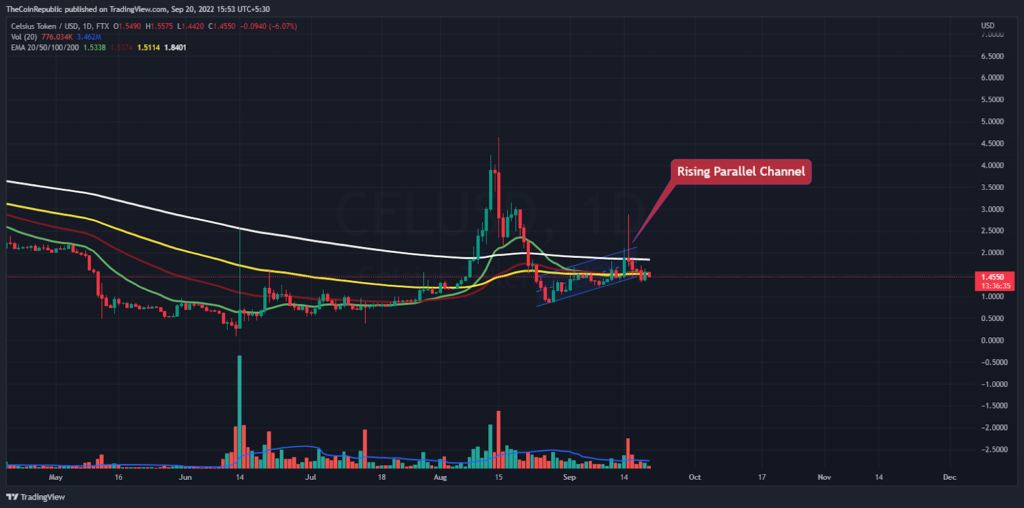
For the CEL coin price to rise more quickly toward the channel’s upper trendline, there must be more buyers. Volume shift indicates that the buildup of bulls is insufficient and must be increased for CEL to skyrocket, nonetheless. To show its recovery phase on the daily price chart, the CEL coin price must rise toward the upper trendline.
What do Technical Indicators suggest about CEL?
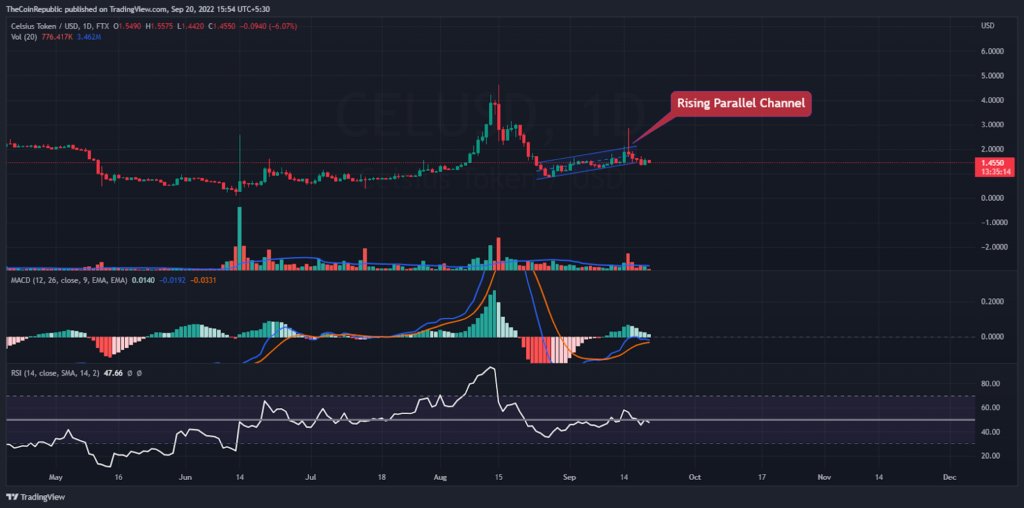
The daily price chart of the CEL cryptocurrency shows a rising parallel channel, which is an attempt by the currency to indicate its recovery. The token must continue to move inside the channel and push past the allowable resistance level in order to maximize recovery. Technical indicators suggest that the fall for the CEL currency is picking up speed.
According to the Relative Strength Index, CEL is currently trading in the neutral area. Wait till the RSI rises back over neutrality before investing in CEL. The MACD shows the downward velocity of the CEL coin. The MACD line is positioned in front of the signal line within the positive zone.
Conclusion
On the daily price chart, the price of Celsius is attempting to climb via an upward channel. The coin is currently gaining as it climbs near the channel’s top trendline. If the CEL coin is to bounce back and achieve a respectable resistance level, it must maintain the momentum of the recent uptrend. For the token to be able to break free of the ascending parallel channel with a powerful bullish surge, CEL bulls must keep the upward momentum going. Bears are attempting to short the CEL market, though. It is difficult for cryptocurrencies like CEL to successfully recover in a bear market. Technical indicators suggest that the fall for the CEL currency is picking up speed. The MACD line is positioned in front of the signal line within the positive zone.
Technical Levels
Support Levels: $1.30 and $1.23
Resistance Levels: $1.65 and $2.00
Disclaimer
The views and opinions stated by the author, or any people named in this article, are for informational ideas only, and they do not establish the financial, investment, or other advice. Investing in or trading crypto assets comes with a risk of financial loss.

With a background in journalism, Ritika Sharma has worked with many reputed media firms focusing on general news such as politics and crime. She joined The Coin Republic as a reporter for crypto, and found a great passion for cryptocurrency, Web3, NFTs and other digital assets. She spends a lot of time researching and delving deeper into these concepts around the clock, and is a strong advocate for women in STEM.


