
 Home
Home News
News

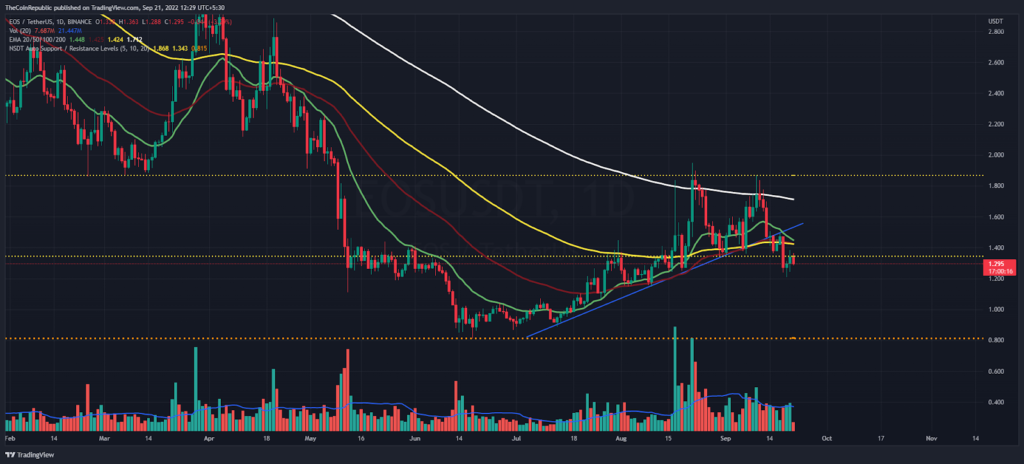
- The EOS price became bearish after slipping below the upwards trendline.
- EOS coin is trading below the significant Exponential moving averages like 20,50,100 and 200.
- The pair price of EOS coin concerning the Bitcoin pair is up 2% at 0.00006774 satoshis.
EOS coin started making the bearish chart patterns on the daily price scale. Although, for the long-term view, the EOS coin’s price action is still bullish until it retest the recent 90 days lowest level. Should investors keep it in their portfolio or sell-out after making nice returns?

At the time of writing, the EOS coin against the USDT pair is trading at $1.3 Mark along with 2.8% intraday drop. The $1.8 to $2.0 zone has a significant selling zone of short-sellers over the daily price scale. As a result, the buyers lost nearly 35% in the last ten trading sessions till last week’s low. Moreover, the price of the EOS coin concerning the Bitcoin pair is up 2% at 0.00006774 satoshis.

The market cap is observing positive at $1.3 Billion as per CMC, up 2.3% in the last 24 hours. Despite today’s gain, the EOS bulls try to keep the price in the green zone over the weekly time frame, as a result it is up by 2%.5% so far. However, the trading volume increased last night by 84%, recorded at $488 Million.
The daily price action shows double top formation close to the immediate resistance zone. Meanwhile, buyers failed to keep up asset price above the ascending trendline (blue) above the chart. Therefore, the coin is trading below the significant Exponential moving averages like 20,50,100 and 200 in terms of the daily price scale.
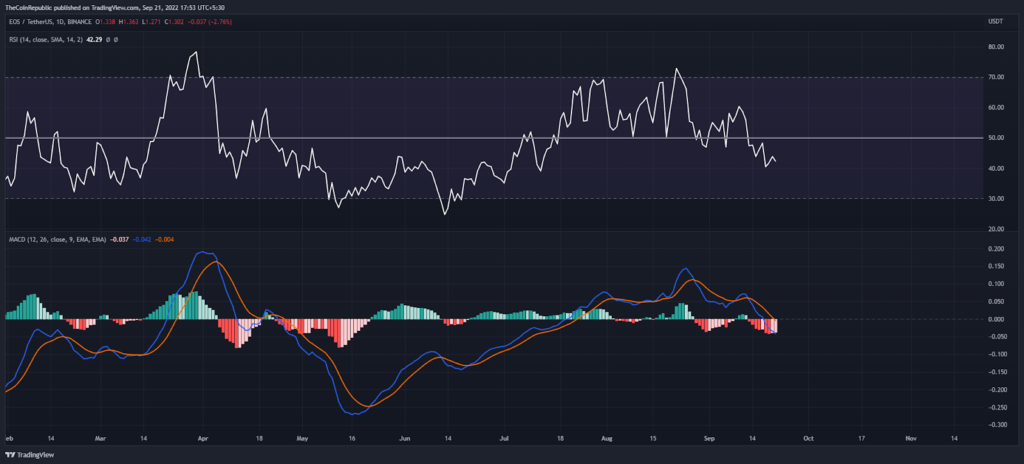
Over the daily price chart, the RSI indicator is remaining below the semi-line, suggesting the negativity for EOS coin. Similarly, the MACD indicator continues to make lower-highs and both moving lines are going to move into the negative region.
Conclusion
After falling below the bullish trendline EOS coin became bearish for a short-term view. The Traditional indicators like EMA, RSI and MACD show uncertainty in price until price retest the next key support level of $1.0
Support level – $1.0 and $0.30
Resistance level – $0.45 and $0.50
Disclaimer
The views and opinions stated by the author, or any people named in this article, are for informational ideas only. They do not establish financial, investment, or other advice. Investing in or trading crypto assets comes with a risk of financial loss.

Andrew is a blockchain developer who developed his interest in cryptocurrencies while pursuing his post-graduation major in blockchain development. He is a keen observer of details and shares his passion for writing, along with coding. His backend knowledge about blockchain helps him give a unique perspective to his writing skills, and a reliable craft at explaining the concepts such as blockchain programming, languages and token minting. He also frequently shares technical details and performance indicators of ICOs and IDOs.


