
 Home
Home News
News

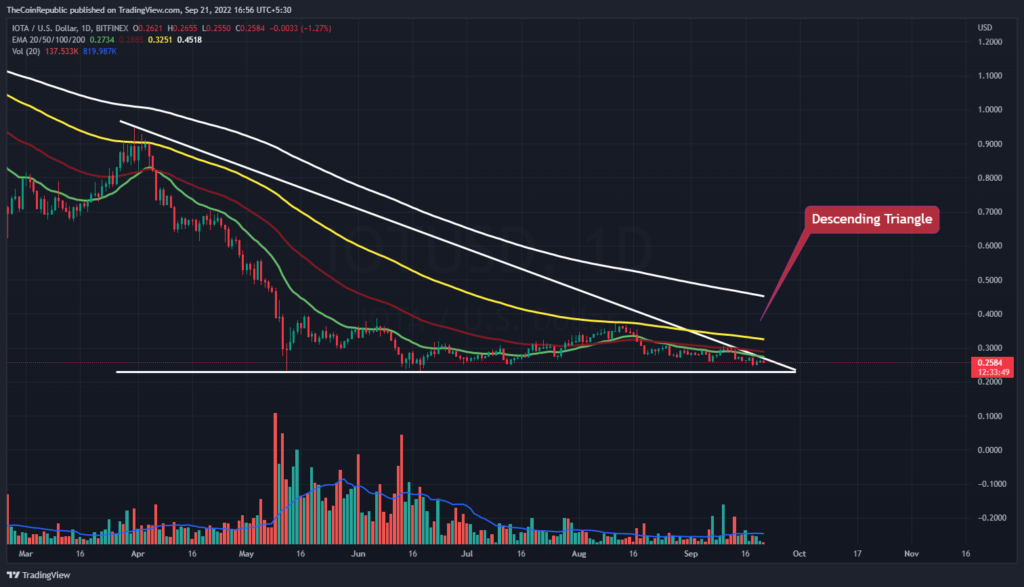
- IOTA price has been consolidating inside the descending triangle pattern over the daily price chart.
- MIOTA crypto is trading below the 20, 50, 100, and 200-day Daily Moving Average.
- The pair of MIOTA/BTC is at 0.00001354 BTC with an intraday gain of 0.80%.
Over the daily price chart, the IOTA price has been falling through a descending triangle pattern. To avoid further collapse, the token needs to reverse the downward trend on the daily price chart. The price of the MIOTA currency must remain where it is trading in order to initiate a breakout from the descending triangle formation. However, bears can attempt to stop the current trend and look for a reversal. Given that MIOTA is currently facing a dire make-or-break situation, bulls must hold onto their position at the present level. MIOTA investors must wait until the token breaks out of its downward trend and bulls maintain their positions.

IOTA currently has a market value of $0.258 and has lost 0.27% of that value over the past day. However, during the intraday trading session, trading volume decreased by 7.7%. This shows that bears are attempting to retreat so that IOTA can exit the descending triangle pattern. The volume to market cap ratio is 0.01502.

To confirm its breakout from the descending triangle formation on the daily price chart, the price of the MIOTA token must stay at this level. Investors need to wait for bulls to build up strength before the IOTA coin is forced out of its downward trend. The volume change, which is now below average, needs to be increased. According to this projection, MIOTA bulls must stockpile more of themselves in order to avoid falling victim to any sort of bearish trap.
What do Technical Indicators suggest about IOTA?
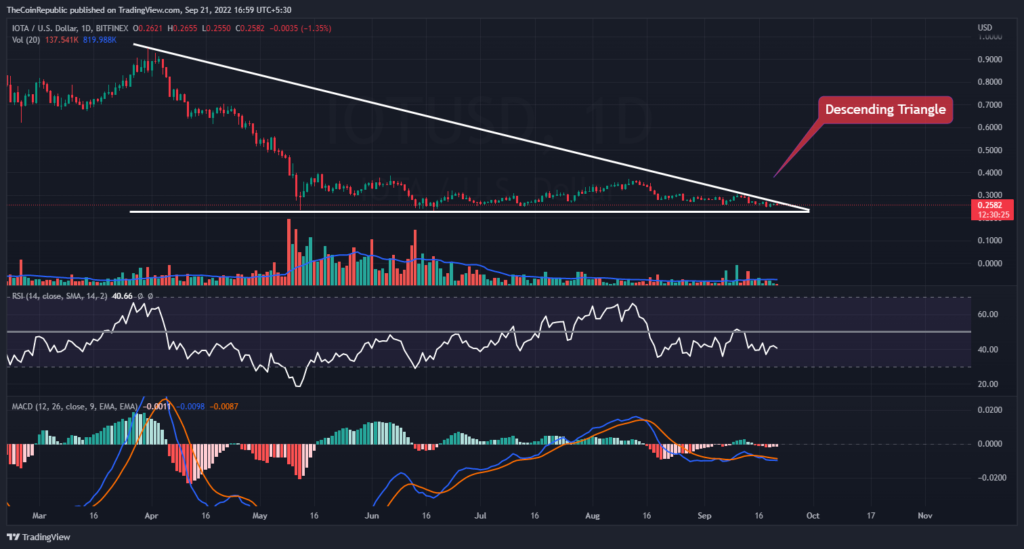
The price of MIOTA has been fluctuating inside a descending triangle trend since April 2022. On the daily price chart, the token initially suffered a big loss, but as of right now, it is trading in the direction of its breakout and the start of its recovery phase. Technical indicators point to a slowing of the MIOTA currency drop.
The relative strength index shows how much MIOTA has decreased. The RSI is getting close to the oversold territory at 40. The MIOTA currency’s negative momentum can be seen on MACD. The signal line and the MACD line are on the verge of crossing adversely.
Conclusion
Over the daily price chart, the IOTA price has been falling through a descending triangle pattern. To avoid further collapse, the token needs to reverse the downward trend on the daily price chart. The price of the MIOTA currency must remain where it is trading in order to initiate a breakout from the descending triangle formation. However, bears can attempt to stop the current trend and look for a reversal. Given that MIOTA is currently facing a dire make-or-break situation, bulls must hold onto their position at the present level. According to this projection, MIOTA bulls must stockpile more of themselves in order to avoid falling victim to any sort of bearish trap. Technical indicators point to a slowing of the MIOTA currency drop. The signal line and the MACD line are on the verge of crossing adversely.
Technical Levels
Support Levels: $0.25 and $0.22
Resistance Levels: $0.30 and $0.35
Disclaimer
The views and opinions stated by the author, or any people named in this article, are for informational ideas only, and they do not establish any financial, investment, or other advice. Investing in or trading crypto assets comes with a risk of financial loss.
Steve Anderson is an Australian crypto enthusiast. He is a specialist in management and trading for over 5 years. Steve has worked as a crypto trader, he loves learning about decentralisation, understanding the true potential of the blockchain.


