
 Home
Home News
News

- Tron price has been consolidating inside the range over the daily price chart.
- TRX crypto has fallen below 20, 50, 100 and 200-days Daily Moving Average.
- The pair of TRX/BTC is at 0.000003123 BTC with an intraday drop of 2.20%.
Over the course of one day, the price of Tron witnessed a variety of significant changes. The cryptocurrency initially entered a downward channel on the daily chart before attempting to change course inside an adjacent ascending channel. Then, as TRX entered a pattern known as a rounding bottom, another correction occurred. The token experienced a spectacular roller-coaster journey throughout this time. The TRX coin is currently trying to hold onto its upper range as the token hunts for support at a higher level during the consolidation phase.

Tron’s market value is up 0.73% from yesterday at $0.06028 CMP. Throughout the day, the transaction volume decreased by 12.08%. This demonstrates that bears are making an effort to congregate to watch the token fall apart. The volume to market cap ratio is 0.0633.

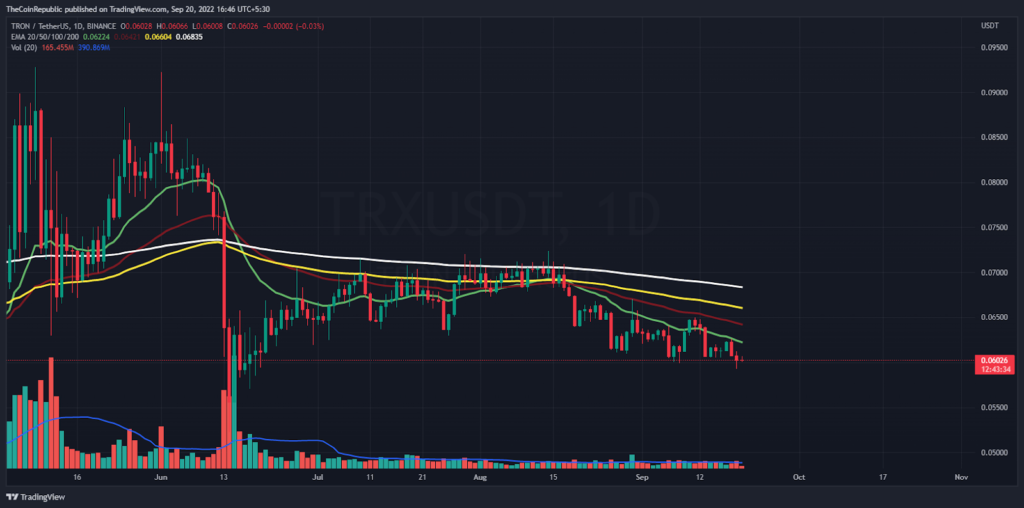
The TRX coin price is striving to exit the range-bound area on the daily price chart. The token intends to defy the trend of rising token prices. One TRX currency has cost between $0.061 and $0.070 continuously. To move TRX outside of the range, the volume shift must be greater than usual. However, bears might reject the trend and move the token in a different direction.
What do Technical Indicators suggest about TRX?
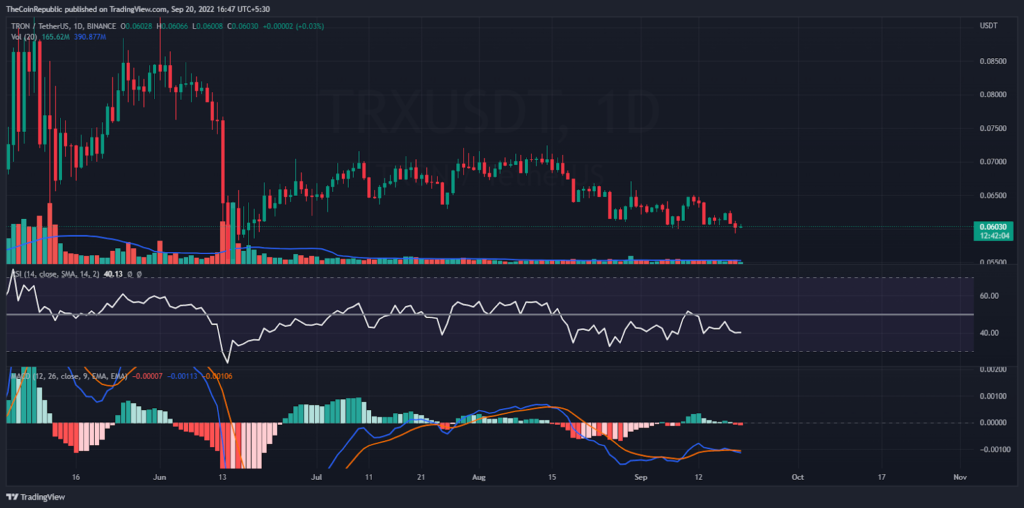
On the daily price chart, TRX is rising near the upper trendline of the consolidation phase. For the cryptocurrency to penetrate the range-bound region, it has to have strong bullish momentum. The sideways movement of the TRX coin is shown by technical indicators.
The Relative Strength Index shows how strong TRX’s sideways movement is. The RSI is level below neutrality at 40. On MACD, the TRX coin’s bearish momentum is apparent. The MACD line is lower than the signal line following a negative crossover. Investors in TRX need to keep an eye on the daily chart for any changes in trend.
Conclusion
Over the course of one day, the price of Tron witnessed a variety of significant changes. The cryptocurrency initially entered a downward channel on the daily chart before attempting to change course inside an adjacent ascending channel. Then, as TRX entered a pattern known as a rounding bottom, another correction occurred. The token experienced a spectacular roller-coaster journey throughout this time. However, bears might reject the trend and move the token in a different direction. The sideways movement of the TRX coin is shown by technical indicators. Investors in TRX need to keep an eye on the daily chart for any changes in trend.
Technical Levels
Support Level: $0.060 and $0.055
Resistance Level: $0.062 and $0.065
Disclaimer
The views and opinions stated by the author, or any people named in this article, are for informational ideas only, and they do not establish the financial, investment, or other advice. Investing in or trading crypto assets comes with a risk of financial loss.

Nancy J. Allen is a crypto enthusiast, with a major in macroeconomics and minor in business statistics. She believes that cryptocurrencies inspire people to be their own banks, and step aside from traditional monetary exchange systems. She is also intrigued by blockchain technology and its functioning. She frequently researches, and posts content on the top altcoins, their theoretical working principles and technical price predictions.


