
 Home
Home News
News

- The XDC Network coin (XDC) is headed towards the 20 day exponential moving average.
- The XDC coin became the top gaininer as per the CMC along with 8.3% gain over the night.
- Bulls struggle at 100 day exponential moving average in daily price chart.
The XDC Network is outperforming for the past four trading sessions. Recently, buyers prevent themselves from a more sideways trend, which has been occurring since early September. This bullish momentum is attracting buyers to make new long-positions until the price reaches the $0.040 bullish hurdle.

Weekly Chart of XDC
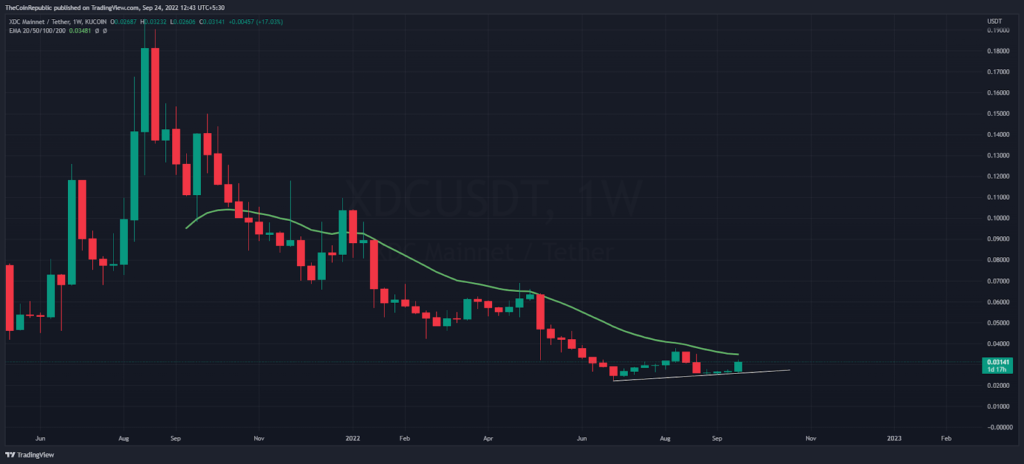
The weekly chart of XDC Network is showing a high-low trend above the bullish trend line (above the chart). Just prior to the 6 trading sessions, the bulls were battling a sideways trend close to this bullish trend line, but these buyers saw a rise of around 17% so far this week. After three weeks, the bulls appear aggressive and the price is moving towards the 20-day exponential moving average.

After a bullish momentum, the XDC network rose above the $0.030 area while the coin was trading at the $0.0312 mark at the time of writing. The price is likely to reach the $0.0348 level before any significant decline occurs. Furthermore, the XDC coin with the bitcoin pair at 9.98% 0.000001645 satoshis is in the green zone.
Buyers Struggle at 100-EMA
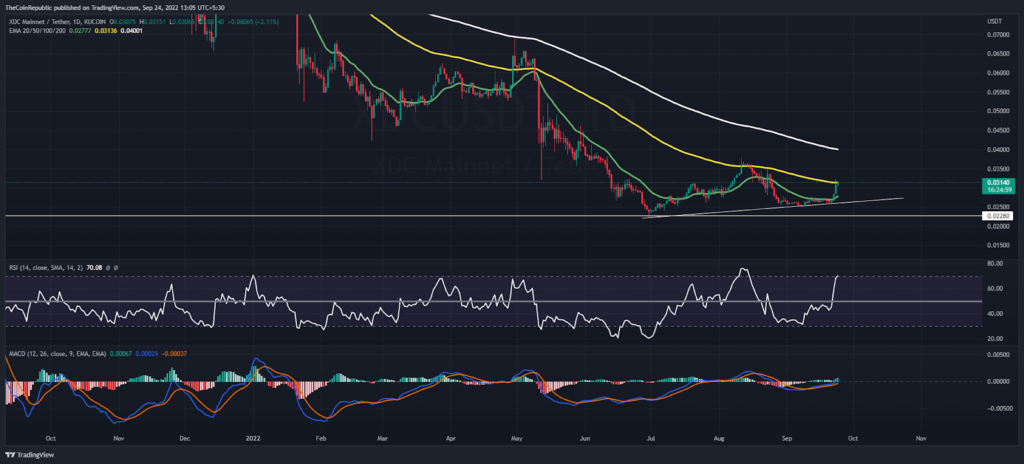
On the daily price chart, the bulls are struggling at the 100 day exponential moving average (yellow). Moreover, the 20 and 50-EMA are trading below the current price of the XDC network. If buyers reclaim the asset above the 100-EMA, the next resistance will be the 200-EMA.
The RSI indicator is about to enter an overbought zone on the daily price scale. Similarly, the MACD indicator is moving towards a positive zone with a higher-highs histogram.
Conclusion
The XDC Network (XDC) is at a major level during the weekly close. If buyers close the weekly price close above the 100-day exponential moving average, a more bullish rally could occur.
Support level – $0.025 and $0.020
Resistance level – $0.036 and $0.060
Disclaimer
The views and opinions stated by the author, or any people named in this article, are for informational ideas only. They do not establish financial, investment, or other advice. Investing in or trading crypto assets comes with a risk of financial loss.

Nancy J. Allen is a crypto enthusiast, with a major in macroeconomics and minor in business statistics. She believes that cryptocurrencies inspire people to be their own banks, and step aside from traditional monetary exchange systems. She is also intrigued by blockchain technology and its functioning. She frequently researches, and posts content on the top altcoins, their theoretical working principles and technical price predictions.


