
 Home
Home News
News
- XRP price has finally escaped the consultation phase at 2021 lows and has shown significant bullish momentum.
- XRP crypto has soared above 20, 50, 100 and 200-days Daily Moving Average.
- The pair of XRP/BTC is at 0.00002599 BTC with an intraday drop of 0.90%.
XRP price has been consolidating inside the horizontal range bound area at 2021 since June 2022 over the daily chart. The token tried to accumulate buyers earlier many times but failed to sustain at the upper price range but now XRP investors have finally witnessed the token’s recovery phase. XRP coin price must surge above $1.00 to register the topken’s significant recovery. However, the accumulation at the moment is not upto the mark and XRP may experience short-selling pressure over the daily price chart.

XRP price is presently approximated at $0.4973 and has dropped 1.36% of its market capitalization in the last 24-hour period. Trading volume has decreased by 18% in the intraday trading session. This demonstrates that sellers are accumulating to pull back the XRP crypto. Volume to market cap ratio is 0.2418.

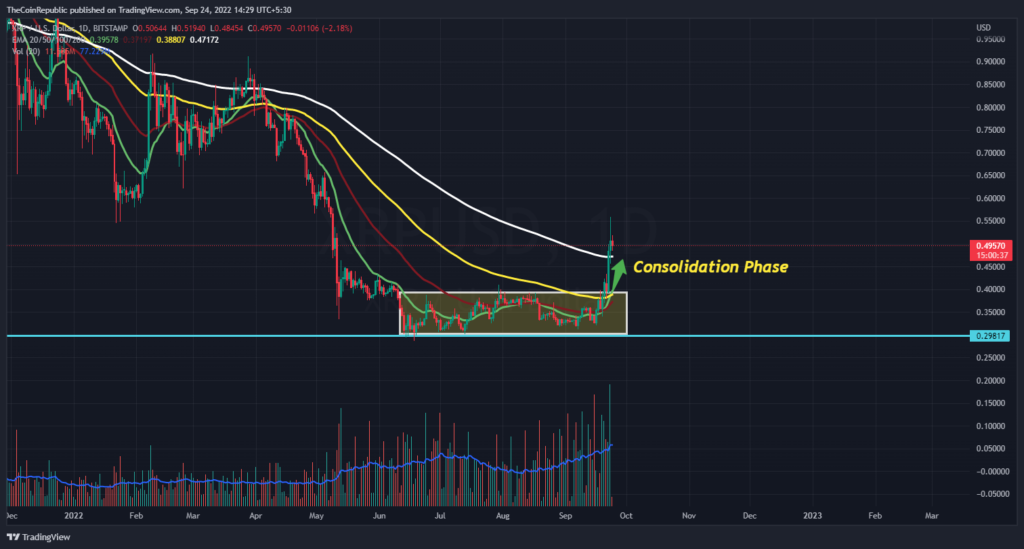
XRP coin price has finally escaped the consolidation phase and is now witnessing its recovery over the daily chart. However, it looks like bulls are struggling to sustain at the current level as sellers are trying to reverse the trend of XRP crypto. Meanwhile, volume change can be seen below average under the influence of sellers. XRP bulls must accumulate themselves to continue the token’s recovery phase.
XRP Bulls Sustain or Get Detained?
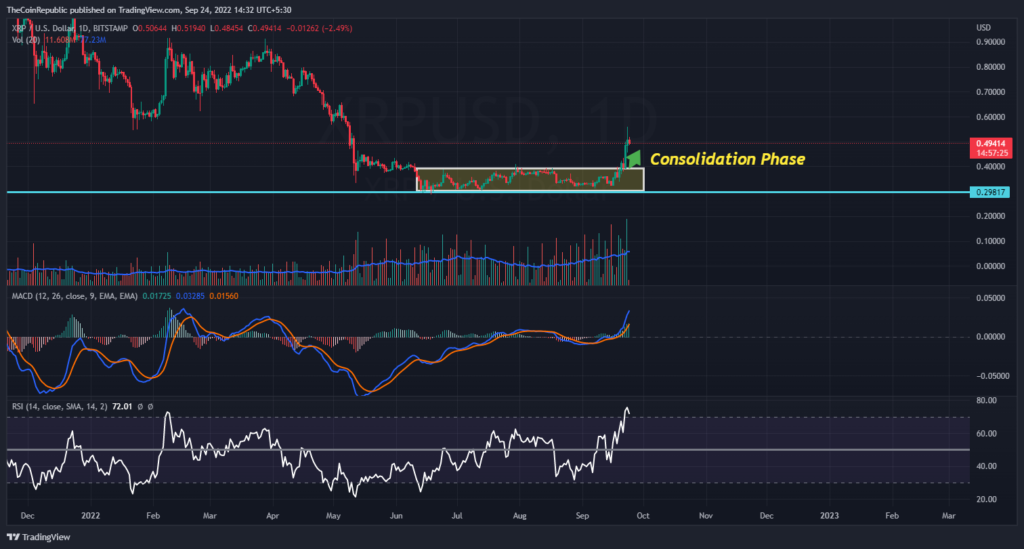
The technical indicators suggest that XRP bulls are struggling to maintain the uptrend momentum of the token as they failed to sustain and sellers are approaching. Therefore, the downtrend momentum of XRP crypto is being showcased by technical indicators.
Relative Strength Index showcases the return of the token from overbought territory. RSI is at 72 and is returning from overbought territory. MACD exhibits the uptrend momentum of XRP coin. The MACD line is ahead of the signal line after a positive crossover.
Conclusion
XRP price has been consolidating inside the horizontal range bound area at 2021 since June 2022 over the daily chart. The token tried to accumulate buyers earlier many times but failed to sustain at the upper price range but now XRP investors have finally witnessed the token’s recovery phase. XRP coin price must surge above $1.00 to register the topken’s significant recovery. Meanwhile, volume change can be seen below average under the influence of sellers. XRP bulls must accumulate themselves to continue the token’s recovery phase. Therefore, the downtrend momentum of XRP crypto is being showcased by technical indicators. The MACD line is ahead of the signal line after a positive crossover.
Technical Levels
Support Levels: $0.45 and $0.40
Resistance Levels: $0.55 and $1.00
Disclaimer
The views and opinions stated by the author, or any people named in this article, are for informational ideas only, and they do not establish the financial, investment, or other advice. Investing in or trading crypto assets comes with a risk of financial loss.

With a background in journalism, Ritika Sharma has worked with many reputed media firms focusing on general news such as politics and crime. She joined The Coin Republic as a reporter for crypto, and found a great passion for cryptocurrency, Web3, NFTs and other digital assets. She spends a lot of time researching and delving deeper into these concepts around the clock, and is a strong advocate for women in STEM.


