
 Home
Home News
News

- Decentraland (MANA) price attempted a recovery earlier this week with a 2.5% weekly gain.
- The all-significant exponential moving averages are holding above the current price of the MANA token.
- The MANA token belonging to the bitcoin pair is down 2.7% at 0.000003546 satoshis.
Decentraland Token (MANA) is nearing its 2022 low. Currently, the bears are targeting a new 2022 low while managing costs below the $1.0 level. In mid-August, buyers witnessed a dramatic drop which dashed the expectations of the buyers, subsequently, they continued to receive rejection of the trend reversal.

Decentraland’s native coin MANA shows more devaluation in the market, therefore, bulls wait for strong trend reversal confirmation before forming long positions. Amid a bearish sideways zone, the MANA token is trading at the $0.715 mark against the USDT pair at the time of writing.

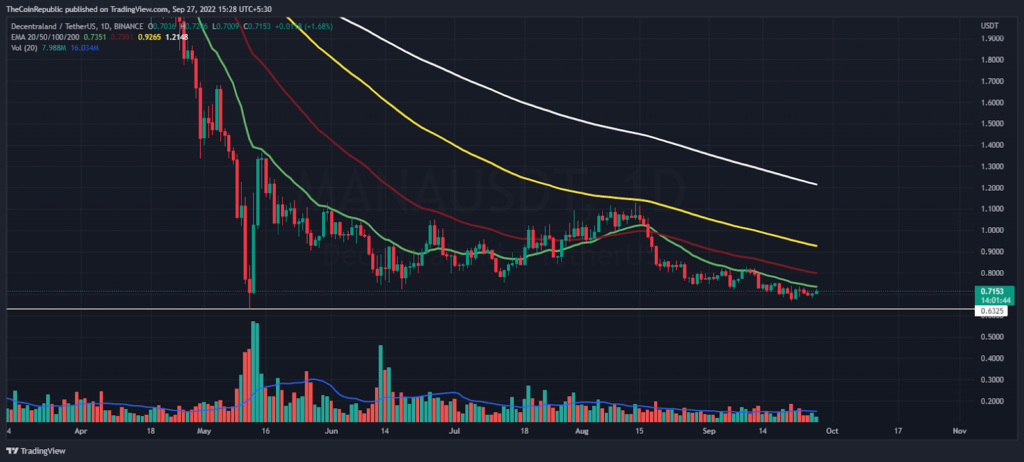
Amid July to August MANA token opened the door for bulls but close to conceptual round level of $1.0 price failed to sustain in higher regions. Hence, round level $1.0 turned into the key resistance level and bulls seem active near $0.63 support level. Nevertheless, the MANA token concerning the Bitcoin pair is down by 2.7% at 0.00003546 satoshis.
After slipping price below the 200-day exponential moving average on 5 April 2022, the MANA token follows a downtrend. As a result, All significant exponential moving averages like 20,50,100 and 200 are remaining above the current price of MANA token. However, buyers are propelling asset price towards 20-EMA as a first approach.
MACD Shows Uncertainty in MANA Token
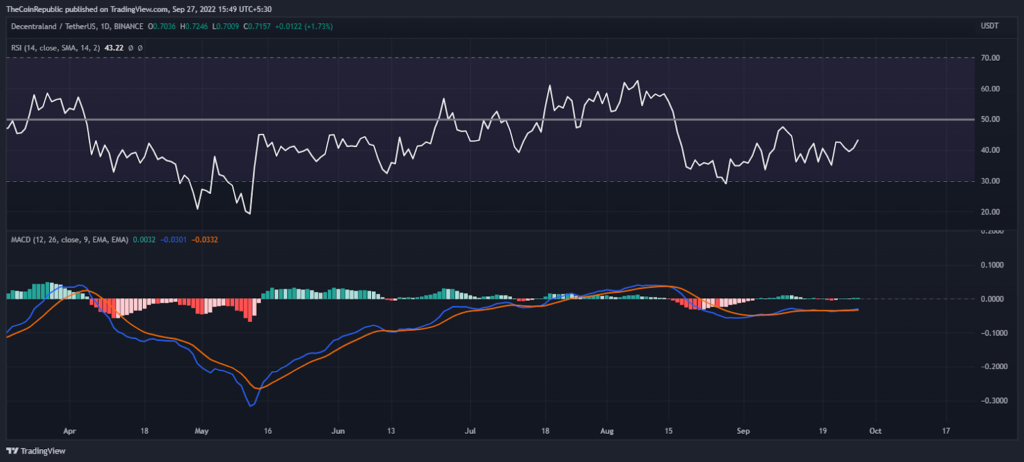
The RSI indicator displays rise from the lower levels. This peak’s rise shows short-term positivity in MANA token until it reverses from the semi-line. But MACD indicator observing flat into the negative zone in the context of daily price chart.
Conclusion
The MACD shows no strong momentum until both moving lines move above the neutral zone. Decentraland bulls attempt little recovery above 20 day exponential moving average based on daily RSI indicator’s bullish indication. However, the support level is not far from the current levels so bears may start short-covering ahead.
Technical Levels
Resistance level- $1.0 and $1.5
Support level- $0.670 and $0.60
Disclaimer
The views and opinions stated by the author, or any people named in this article, are for informational ideas only, and they do not establish the financial, investment, or other advice. Investing in or trading crypto assets comes with a risk of financial loss.

Nancy J. Allen is a crypto enthusiast, with a major in macroeconomics and minor in business statistics. She believes that cryptocurrencies inspire people to be their own banks, and step aside from traditional monetary exchange systems. She is also intrigued by blockchain technology and its functioning. She frequently researches, and posts content on the top altcoins, their theoretical working principles and technical price predictions.


