
 Home
Home News
News

- The helium coin rests under the symmetrical triangle pattern.
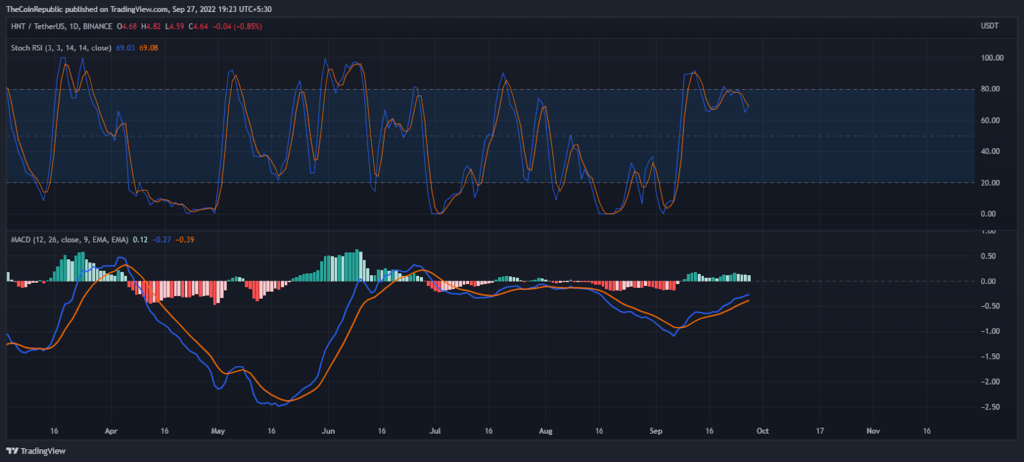
- The MACD indicator is moving towards the neutral zone with a higher histogram.
- The price of the HNT pair with the Bitcoin pair is down 5.7% at 0.0002291 satoshis.
The Helium Coin (HNT) is approaching its 2022 yearly bottom. Due to its unidirectional swings, the Helium Coin (HNT) was an exceptionally volatile asset in early 2022. Because of the excessive instability, many shareholders have sold their holdings. With each rise in the price, the bears continue to push down the HNT price, which is currently at an all-time high of $59.27. Even after such a sell-off, the bears retain control of the assets.

Buyers try to hedge against a more significant decline in prices around the yearly low. As a result, the price movement has formed a high-low and low-high pattern during the last few days. In actuality, the price is still trapped in a symmetrical triangular pattern (bottom of the chart).

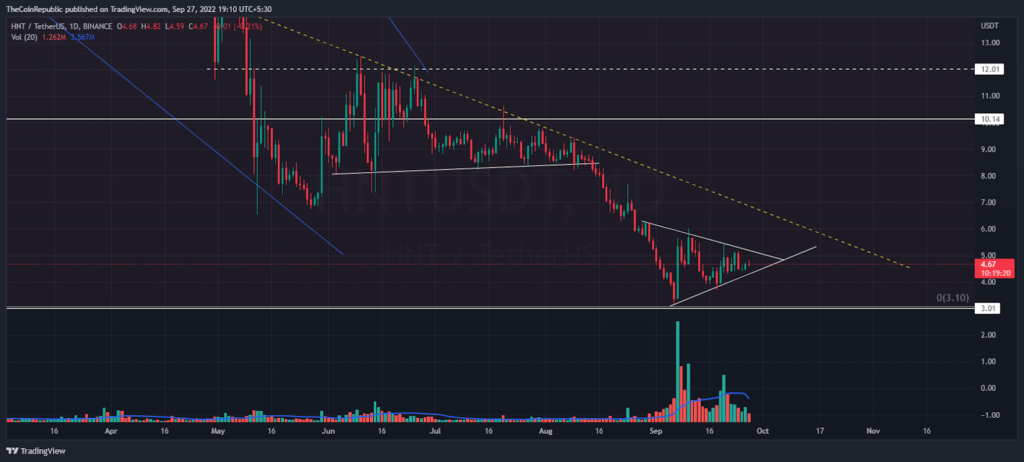
Against the USDT pair, the Helium coin is trading at $4.6 Mark at the time of writing. Gradually, the range of symmetrical triangle patterns is getting narrow and at any time price may see rapid momentum. Nonetheless, the pair price of HNT along with the Bitcoin pair is down by 5.7% at 0.0002291 satoshis.
MACD Shows Positivity for HNT Crypto
The key support level for the HNT coin is $3.0, which has provided the price bounce several times. On the other hand, a near conceptual round level of $10 is standing as a hedge zone for the bears.
Stoch RSI indicator started a downside move from the higher zone. If the bears turn aggressive towards the RSI, the price may further decline below the support trend line. Moreover, the MACD indicator is moving towards a neutral zone with a higher histogram in the context of the daily price chart.
Conclusion
The Helium Coin (HNT) is seen sideways in the middle of a symmetrical triangle pattern. At this point, the Stoch RSI indicator started a downside move from the higher zone and is showing negative signs for the upcoming trading session.
Support level- $4.0 and $3.0
Resistance level- $6.0 and $10
Disclaimer
The views and opinions stated by the author, or any people named in this article, are for informational ideas only, and they do not establish any financial investment, or other advice. Investing in or trading crypto assets comes with a risk of financial loss.

With a background in journalism, Ritika Sharma has worked with many reputed media firms focusing on general news such as politics and crime. She joined The Coin Republic as a reporter for crypto, and found a great passion for cryptocurrency, Web3, NFTs and other digital assets. She spends a lot of time researching and delving deeper into these concepts around the clock, and is a strong advocate for women in STEM.


