
 Home
Home News
News
- Tron price is indicating a slight recovery in price.
- Buyers successfully reclaimed TRX price above the 20 day EMA.
- Tron coin with bitcoin pair is up a bit 1.06% at 0.000003197 satoshis.
The Tron token is showing a modest 2.7% recovery this week as buyers are trying to move the asset price higher. Just prior to this week, TRX price action was trending downward in a falling wedge pattern (bottom of chart). The breakout raised bullish hopes for investors as the price broke a long-term bearish trend.

After the breakout, the daily price action shows a weak consolidation in the price. However, overall the crypto market seems to be in a consolidation phase as the market leader-Bitcoin trades below the key $20K level. Meanwhile, Tron coin is trading at $0.0613 mark at the time of writing in intraday trading session against USDT pair.

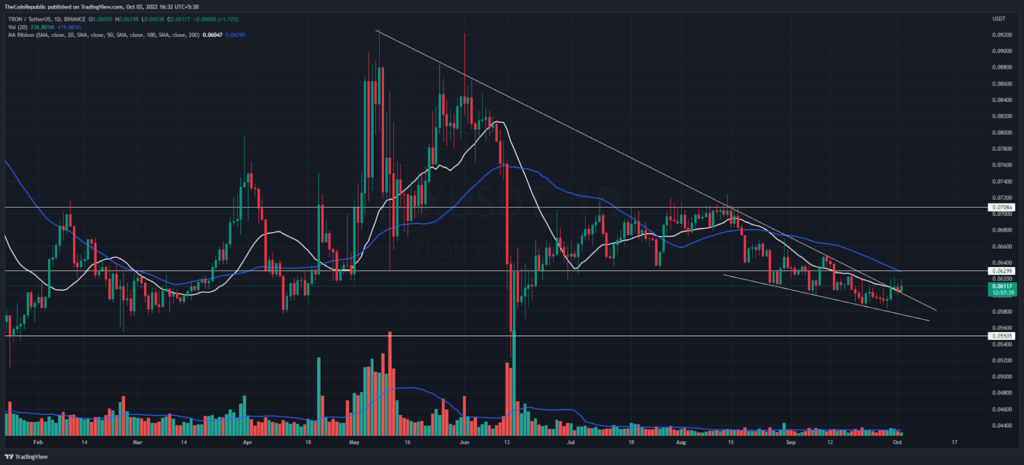
Amid price recovery the weekly price candle observes inside the previous bearish weekend, and value is up 2.5% this week. More bullish rally is likely above the weekly swing high of $0.06232 level. Above this resistance level, buyers may accumulate coins with strong advance confirmation.
Notably Buyers successfully reclaimed the TRX value above the 20 day moving average. Although, trading volume was neutral last night at $350 million and the Tron coin along with the bitcoin pair is slightly up 1.06% at 0.000003197 Satoshis.
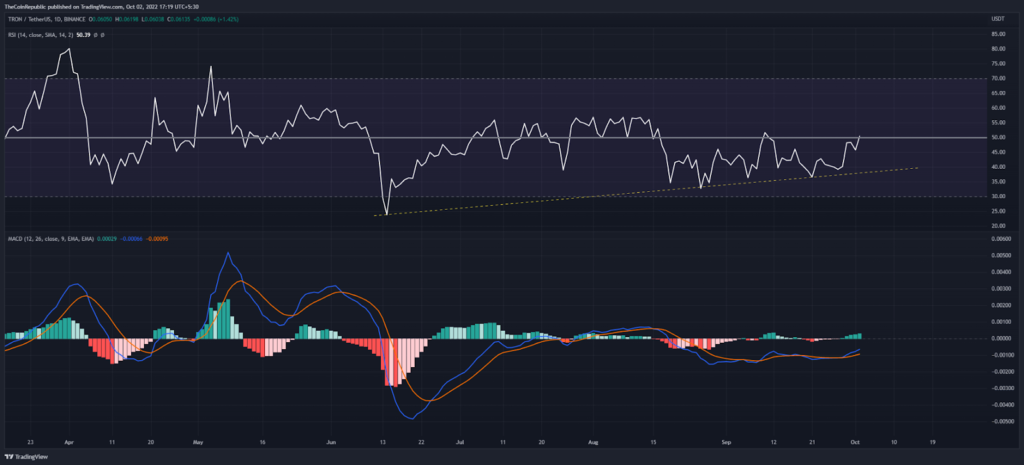
The RSI indicator is expecting a break above the support trend line, while its peak is about to escape the halfway mark. Before the intraday session, the RSI has already received two rejections near the 50 level. Similarly, the MACD is showing positive sentiments after a crossover move for Tron coin and the histogram.
conclusion
Tron coin is moving with a bullish price pattern moving towards the $0.063 resistance level. Meanwhile, buyers move prices above the 20 DMA on the daily chart. The RSI and MACD indicators are showing positive signs for the upcoming trading sessions.
Resistance level- $0.070 and $0.010
Support level- $0.055 and $0.050
Disclaimer
The views and opinions stated by the author, or any people named in this article, are for informational ideas only, and they do not establish the financial, investment, or other advice. Investing in or trading crypto assets comes with a risk of financial loss.
Steve Anderson is an Australian crypto enthusiast. He is a specialist in management and trading for over 5 years. Steve has worked as a crypto trader, he loves learning about decentralisation, understanding the true potential of the blockchain.


