
 Home
Home News
News

- Tron price is trying to sustain above $0.060 after a bullish rally over the daily price chart.
- TRX crypto is trading above 20 EMA but has fallen below 50, 100 and 200-days Daily Moving Average.
- The pair of TRX/BTC is at 0.000003197 BTC with an intraday gain of 0.19%.
Over the course of a single day, there were several major changes in the price of Tron. The cryptocurrency initially entered a downward channel on the daily chart before attempting to change course inside an adjacent ascending channel. Then, as TRX entered a pattern known as a rounding bottom, another correction occurred. The token experienced a wonderful roller-coaster trip at this time. The TRX coin is currently trying to hang onto its upper range as the token hunts for support at a higher level during the consolidation phase.

Tron’s market value is up 0.07% from yesterday, standing at $0.06242 CMP. Throughout the day, there were 21.73% fewer transactions. This demonstrates that bears are making an effort to form a crowd to watch the token fall apart. The volume to market cap ratio is 0.03978.

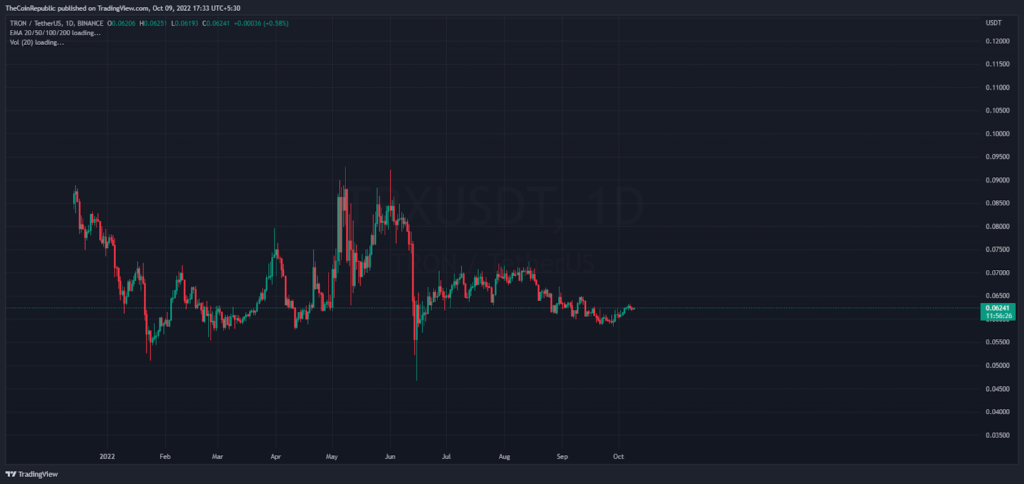
The TRX coin price is striving to exit the range-bound area on the daily price chart. Aiming to buck the growing trend of token values, the token. One TRX unit has always cost between $0.058 and $0.065, on average. To move TRX outside of the range, the volume shift must be greater than usual. Bears may reject the trend, which would cause the token to go in a different direction.
What do Technical Indicators suggest about TRX?
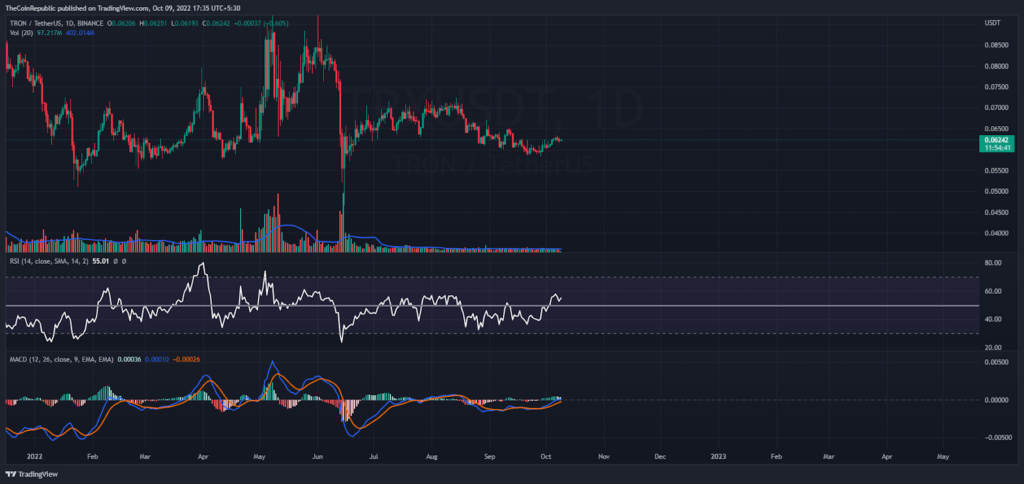
On the daily price chart, TRX is rising very near the top trendline of the consolidation phase. To exit the range-bound zone, the cryptocurrency must be moving aggressively in the bullish direction. Technical signs show that the coin is moving sideways.
The Relative Strength Index shows how strong TRX’s sideways movement is. At 55, the RSI is in a neutral position and is moving towards overbought territory. On MACD, the positive momentum of the TRX coin is apparent. The MACD line rises above the signal line following a positive crossover. Investors in TRX must keep an eye on the daily chart for any changes in trend.
Conclusion
Over the course of a single day, there were several major changes in the price of Tron. The cryptocurrency initially entered a downward channel on the daily chart before attempting to change course inside an adjacent ascending channel. Then, as TRX entered a pattern known as a rounding bottom, another correction occurred. The token experienced a wonderful roller-coaster trip at this time. To move TRX outside of the range, the volume shift must be greater than usual. Bears may reject the trend, which would cause the token to go in a different direction. Technical signs show that the coin is moving sideways.
Technical Levels
Support Level: $0.058 and $0.055
Resistance Level: $0.062 and $0.065
Disclaimer
The views and opinions stated by the author, or any people named in this article, are for informational ideas only, and they do not establish the financial, investment, or other advice. Investing in or trading crypto assets comes with a risk of financial loss.

Andrew is a blockchain developer who developed his interest in cryptocurrencies while pursuing his post-graduation major in blockchain development. He is a keen observer of details and shares his passion for writing, along with coding. His backend knowledge about blockchain helps him give a unique perspective to his writing skills, and a reliable craft at explaining the concepts such as blockchain programming, languages and token minting. He also frequently shares technical details and performance indicators of ICOs and IDOs.


