
 Home
Home News
News

Investors thought that cryptocurrency is a good hedge against inflation, but now there is only despair as the crypto market is witnessing selling pressure. In 2020 the crypto market recorded more depreciation than appreciation. This is because of the market leader Bitcoin as the bears don’t want to lose $20K.

Thus the total crypto market capitalization fell by 2.30% overnight, recorded at $919.58 billion. It continues to slip below the $1 trillion mark. As a result of which most cryptocurrencies including BTC value fell over 60% this year. Yet buyers continue to try to prevent overselling but this seems a bit impossible.

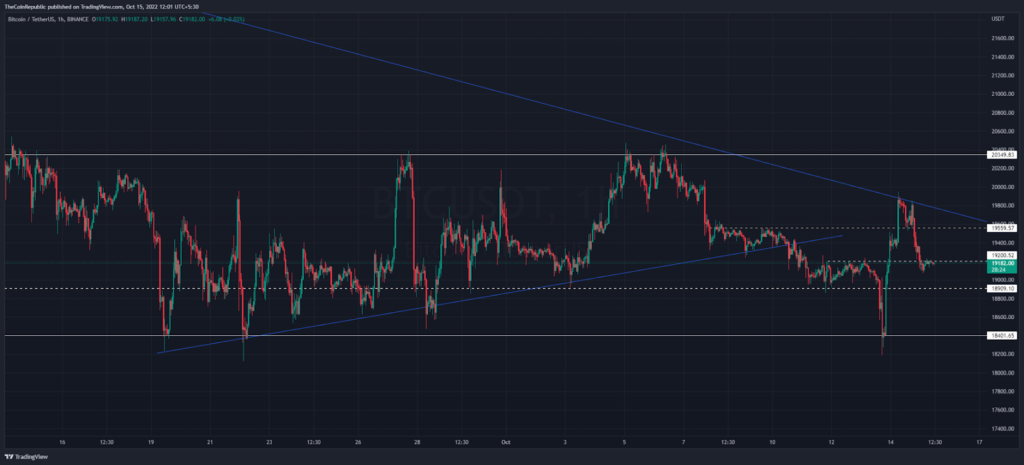
Bitcoin price (BTC) is bouncing back towards the $19K support level after a sudden price recovery on the hourly chart. The price of BTC has been range bound since mid-September. The bears have set a resistance level of $20,350 to $20,450. On the other hand, barley buyers are maintaining their presence near the $18,400 support level.
On the hourly price chart, the BTC price is shifting to higher lower levels below previous highs. A more uniform pattern could put more selling pressure in the market. However, buyers keep bitcoin prices above $19K, which acts as a key support for the month.
Amidst the sideways range, the price of the most popular crypto currency- Bitcoin stands at the $19,172 mark at the time of writing. In the intraday trading session, its observation turned sideways as trading volume fell 34% to $32.29 billion last night. The nature of bitcoin is volatile and it now seems to be sideways, which means no major movement is ever going to happen.
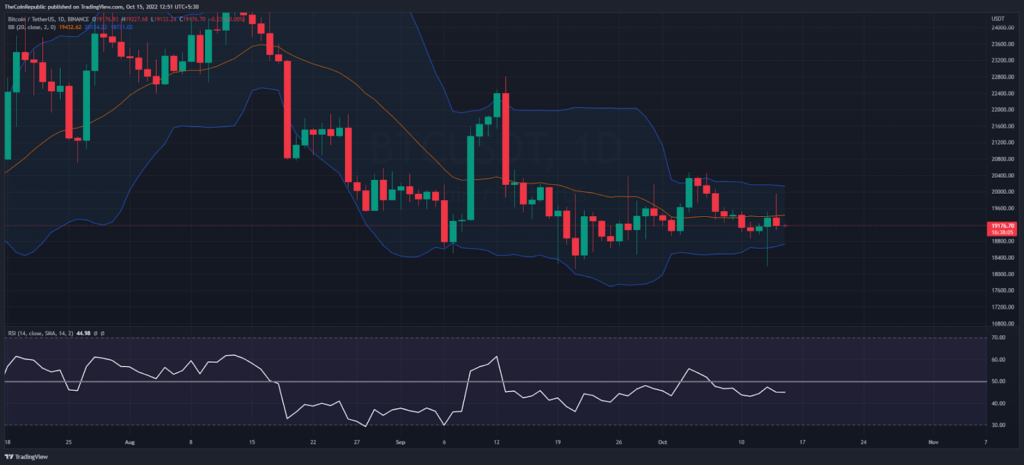
The middle band of the Bollinger Bands indicator has been a volatility red zone for the past several days. When buyers struggle at this level, it acts as an immediate resistance zone for the week. Furthermore, the lower band of the BB indicator provides the price pump so far.
Undoubtedly the bulls try for a price recovery, but the RSI indicator is attracting a low-high pattern in the context of the daily price chart. Now it is below the semi-line.
Conclusion
In the intraday trading session, the price of bitcoin faced a fall. The bearish trend and the middle band of the Bollinger Bands put selling pressure on BTC price, so the bears are aiming to retest $19K soon. However, the nature of bitcoin is volatile and it now seems to be sideways, which means there could be some major momentum ahead..
Resistance level- $20,000 and $22,500
Support level- $19,000 and $18,000
Disclaimer
The views and opinions stated by the author, or any people named in this article, are for informational ideas only, and they do not establish the financial, investment, or other advice. Investing in or trading crypto assets comes with a risk of financial loss.
Steve Anderson is an Australian crypto enthusiast. He is a specialist in management and trading for over 5 years. Steve has worked as a crypto trader, he loves learning about decentralisation, understanding the true potential of the blockchain.


