
 Home
Home News
News
- Bitcoin cash price bounced back in intraday trading session.
- BCH crypto price forms an ascending trendline structure on the 4-hours chart after a dip.
- Buyers barely defending the ideological round level of $100 stood as support.
The Bitcoin Cash crypto has been unable to ease the selling pressure from its BCH coin. Eventually, the price is again remaining by some numbers to revisit its annual low. This price trend can lead to overselling in the market which may get out of control for the buyers in the upcoming trading sessions. At this point, everyone is waiting for a strong trend signal to form another position either up or down for a short-term outlook.

However, the bulls were restraining themselves till the heavy selling on October 10. This expected sell-off brings an opportunity for market sellers to push bitcoin cash price (BCH) below the $112 level. This was the key support prior to the breakdown, therefore, it is caught in an immediate bullish barrier.

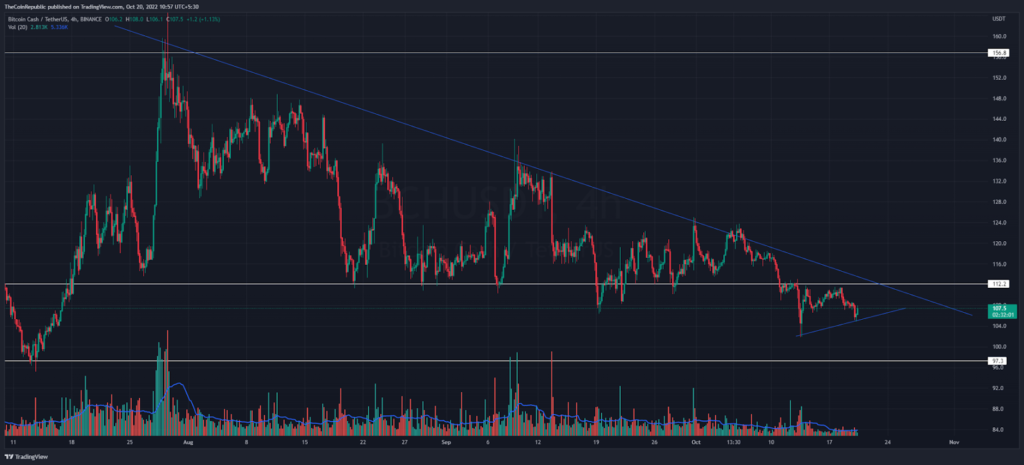
After breaking below the $112 level, BCH buyers are facing a roller-coaster ride. Notable Bitcoin Cash (BCH) crypto has shifted its low above the previous swing low of $101.8. Thus BCH crypto price is forming an ascending trendline structure on the 4-hours chart. This price action could further accelerate towards its immediate resistance. Besides, the $100 conceptual round is an important demand area.
Bitcoin Cash price so far looks bullish with a 1.61% intraday gain at $107.6 while the bears wait to sell near the bearish trend line (above chart). However, trading volume declined overnight to $162.4 million. Nevertheless, bitcoin cash as well as bitcoin pair are looking neutral at 0.00562 satoshis.
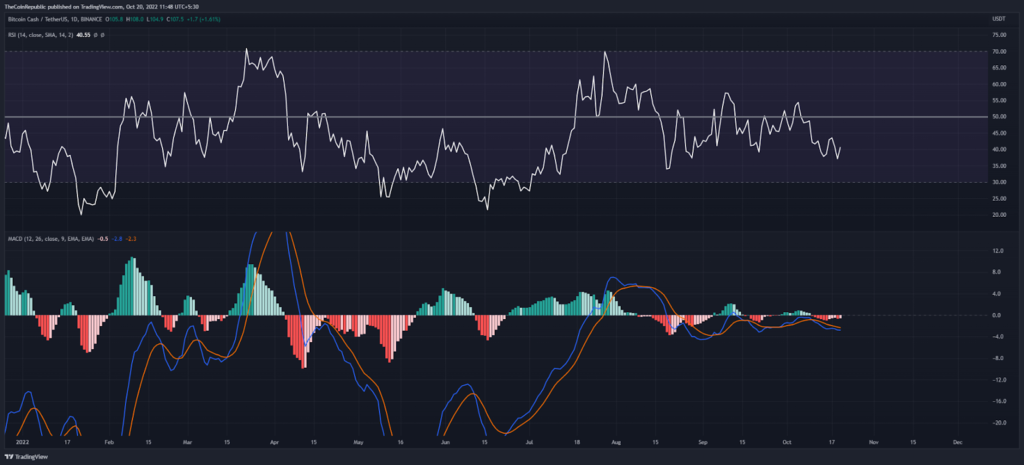
While on the one hand, the price of BCH is turning for a short-term recovery, on the other hand, the MACD continues to move lower in the negative zone. As previous data displays, the RSI indicator is below 50 points for the last 15 days.
Conclusion
The bears again failed to drag the bitcoin cash price towards the $100 conceptual round level. Buyers may struggle to reverse the trend as the trading volume is low as opposed to the 24-hour data and this could lead to less volatility spread in the market. As of now both the indicators are weak for long time, buyers should wait till a strong positive signal.
Support level – $100 and $90
Resistance level – $112 and $135
Disclaimer
The views and opinions stated by the author, or any people named in this article, are for informational ideas only, and they do not establish financial, investment, or other advice. Investing in or trading crypto assets comes with a risk of financial loss.
Steve Anderson is an Australian crypto enthusiast. He is a specialist in management and trading for over 5 years. Steve has worked as a crypto trader, he loves learning about decentralisation, understanding the true potential of the blockchain.


