
 Home
Home News
News

- Ethereum price prediction suggests the consolidation phase of the cryptocurrency over the chart.
- Ethereum, the second largest cryptocurrency after Bitcoin, is trying to gather support to maintain itself above 20, 50, and 100-days Daily Moving Average.
- The pair of ETH/BTC is at 0.07664 BTC with an intraday drop of 0.11%.
Since the last two trading sessions, the price of ethereum has been in a significant fall. The daily price chart for the ETH cryptocurrency shows some fascinating patterns in its trading. The head and shoulders pattern that ETH cryptocurrency initially formed across the chart was followed by a consolidation phase. After the surge on July 26, the price of the ETH coin formed a head and shoulder pattern. Then, as it dropped a little to gather support and then rose again to form a head and shoulder pattern, it encountered short-selling. When the token reached $1760 and made the second shoulder, it then became trapped inside a consolidation phase.

The current estimated price of the Ethereum cryptocurrency is $1630, and during the past 24 hours, it has lost 0.54% of its market value. However, during the intraday trading session, trading volume fell by 33.86%. This shows that short selling pressure is present on the cryptocurrency, but bulls are attempting to buck the trend and allow the coin to soar toward the upper trendline.

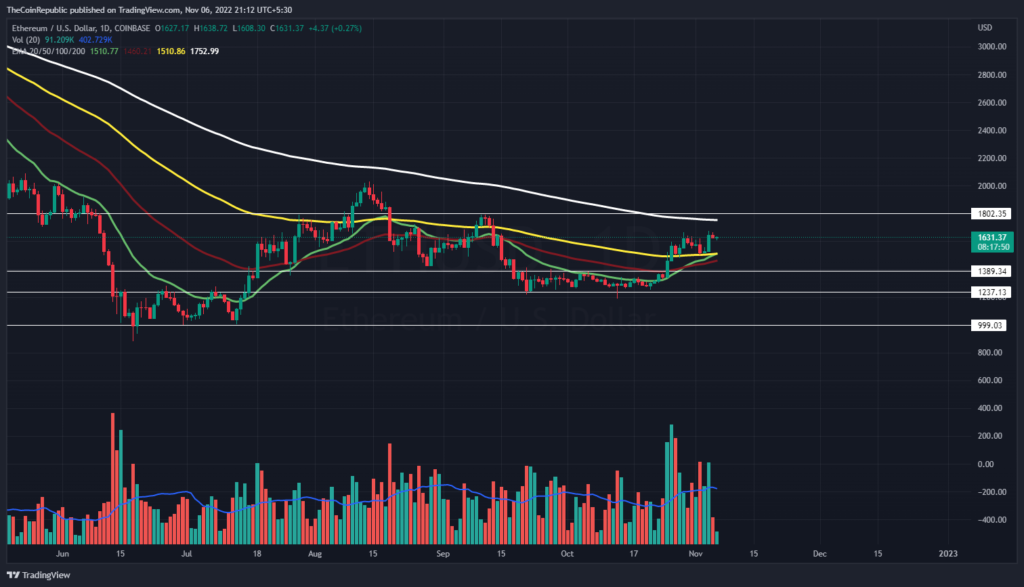
In order to rise again towards the top trendline of the consolidation period, Ethereum must continue to attract buyers. The volume change indicates that the negative pressure is at its maximum and that bulls are now working to manipulate the cryptocurrency to their advantage. Bulls must dramatically increase their accumulation, and ETH must experience buyers rather than sellers during the intraday trading session in order to shift the game of tug of war between the bulls and bears.
What do Technical Indicators suggest about ETH?
In order to advance toward the higher trendline and break out, ETH cryptocurrency needs to gather buyers. Investors in ETH must watch the daily price chart for any directional changes. Technical indications point to the ETH coin’s downward trend momentum.
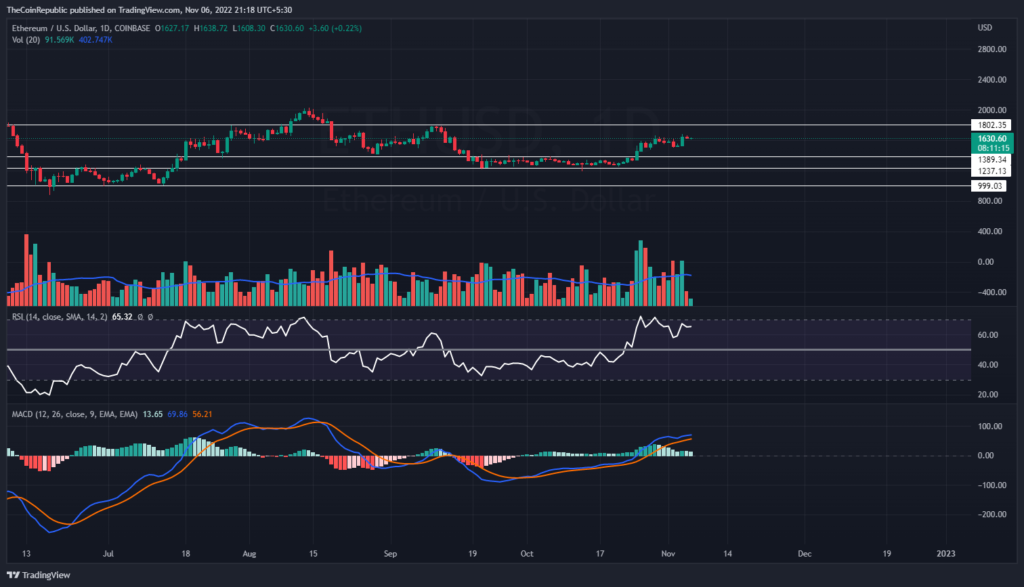
The sideways movement of the ETH coin is displayed by Relative Strength Index. The RSI is flatly below the overbought zone at 65. The bearish momentum of the ETH coin is visible on MACD. The MACD line is about to have a negative crossover with the signal line.
Conclusion
Since the last two trading sessions, the price of ethereum has been in a significant fall. The daily price chart for the ETH cryptocurrency shows some fascinating patterns in its trading. The head and shoulders pattern that ETH cryptocurrency initially formed across the chart was followed by a consolidation phase. Bulls must dramatically increase their accumulation, and ETH must experience buyers rather than sellers during the intraday trading session in order to shift the game of tug of war between the bulls and bears. The MACD line is about to have a negative crossover with the signal line.
Technical Levels
Support Levels: $1500 and $1400
Resistance Levels: $1670 and $1800
Disclaimer
The views and opinions stated by the author, or any people named in this article, are for informational ideas only, and they do not establish the financial, investment, or other advice. Investing in or trading crypto assets comes with a risk of financial loss.

With a background in journalism, Ritika Sharma has worked with many reputed media firms focusing on general news such as politics and crime. She joined The Coin Republic as a reporter for crypto, and found a great passion for cryptocurrency, Web3, NFTs and other digital assets. She spends a lot of time researching and delving deeper into these concepts around the clock, and is a strong advocate for women in STEM.


