
 Home
Home News
News

- XRP price prediction suggests the consolidation phase of the token over the daily price chart.
- XRP crypto has slipped below 20, 50, 100 and 200-days Daily Moving Average.
- The pair of XRP/BTC is at 0.00002279 BTC with an intraday drop of 0.93%.
The strong decline momentum of XRP cryptocurrency is indicated by XRP price prediction. The price of the XRP coin recovered from the prior consolidation period but remained contained by the horizontal range. As it approaches the lower price range of the consolidation phase, the price of the XRP coin needs to draw in more purchasers. In order to advance toward the top price range of the consolidation phase, the XRP cryptocurrency must maintain above the $0.30 level. The price of the XRP coin has been stabilizing between $0.30 and $0.42 while attempting to maintain the lower price range.

The current estimated price of XRP is $0.3735, and during the past 24 hours, the token’s market capitalization has increased by about 0.72%. However, during the intraday trading session, trading volume fell by 24.88%. This indicates how sellers are gathering themselves together in order to withdraw the token.

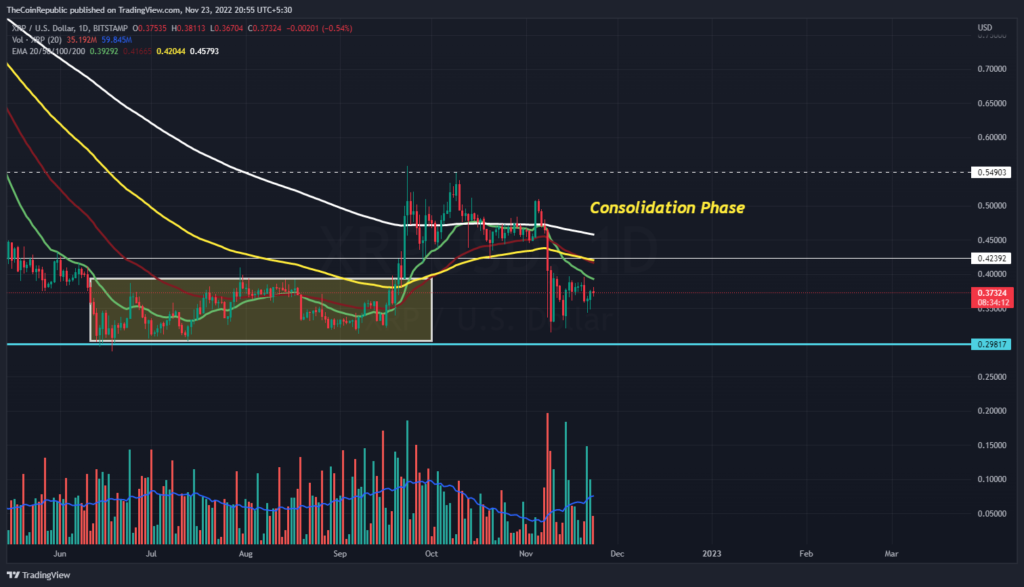
As it approaches the lower price range of the consolidation phase, the price of the XRP coin is attempting to hold at the current level. To shift the direction of the XRP cryptocurrency’s current trend, volume change must increase in favor of bulls and is now above average. The price of XRP has, however, fallen below the 20, 50, 100, and 200-day Daily Moving Averages. Investors in XRP must watch the daily price chart for any directional changes.
What do Technical Indicators suggest about XRP?
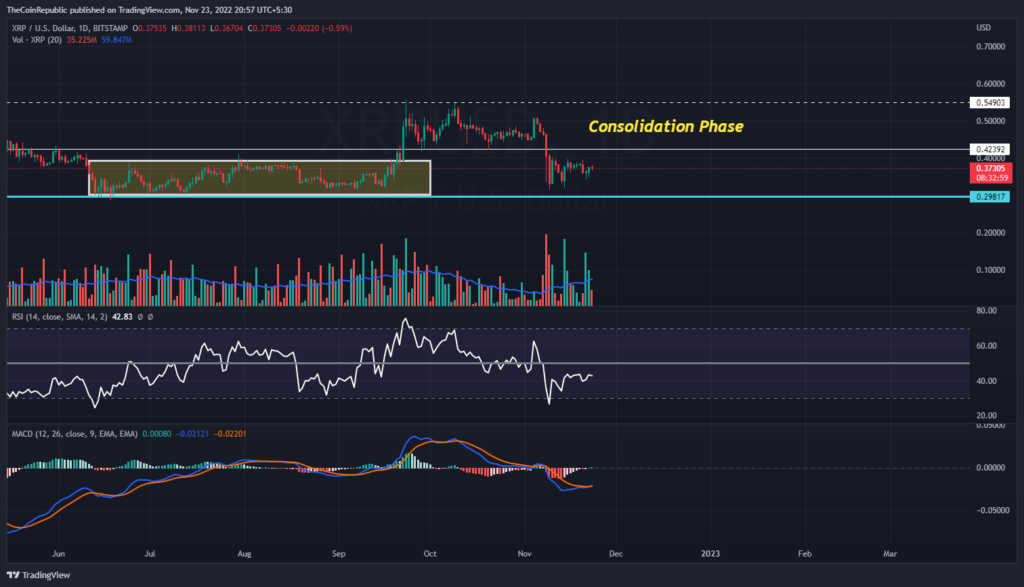
Technical indicators point to the strength of the XRP cryptocurrency’s downturn. The relative strength index shows how quickly the XRP cryptocurrency is declining. The RSI is at 42 and is rapidly approaching oversold territory. The MACD shows that the price of XRP is declining. After a negative crossover, the MACD line is lower than the signal line. Investors in XRP must watch the daily price chart for any directional changes.
Conclusion
The strong decline momentum of XRP cryptocurrency is indicated by XRP price prediction. The price of the XRP coin recovered from the prior consolidation period but remained contained by the horizontal range. As it approaches the lower price range of the consolidation phase, the price of the XRP coin needs to draw in more purchasers. The price of XRP has, however, fallen below the 20, 50, 100, and 200-day Daily Moving Averages. Investors in XRP must watch the daily price chart for any directional changes.
Technical Levels
Support Level: $0.35 and $0.30
Resistance Level $0.40 and $0.42
Disclaimer
The views and opinions stated by the author, or any people named in this article, are for informational ideas only, and they do not establish the financial, investment, or other advice. Investing in or trading crypto assets comes with a risk of financial loss.
Mr, Nikhil Ingole is a Chief Editor at The Coin Republic with over five years of technical analysis & trading experience in Forex and Crypto. As a commerce graduate, he has taken a keen interest in blockchain’s future potentials in the financial industry. A keen cryptocurrency enthusiast, he is very supportive of new media projects, pioneer ideas and the Bitcoin community. He possesses strong technical, analytical skills and is well known for his financial market’s informative analysis. Other than crypto, Nikhil Loves to watch his favorite football team and keep up to date with the latest Formula 1 racing.


