
 Home
Home News
News

- Shiba Inu price prediction suggests the consolidation phase of SHIB crypto inside the descending triangle pattern over the daily price chart.
- SHIB crypto has fallen below 20, 50, 100 and 200-days Daily Moving Average.
- The pair of SHIB/BTC is at 0.000000000545 BTC with an intraday drop of 0.59%.
The caged state of the token inside the descending triangle pattern over the daily price chart is suggested by the Shiba Inu price prediction. In order to recover above the daily price chart, SHIb cryptocurrency must get out of its current situation. The SHIB army must wait until the token exits the consolidation state and emerges from the descending triangle pattern in its recovery phase. Shiba Inu’s price experienced an interesting roller coaster ride over the course of the daily price chart, initially failing to break out of the descending triangle pattern and becoming trapped inside the consolidation phase. After recovering, the token was able to break free of the consolidation phase, but it was then caught back inside the falling triangle pattern.

Shiba Inu’s price is presently estimated at $0.00000918, and during the past 24 hours, it has lost 0.41% of its market value. The intraday trading session has seen a 19.26% reduction in trade volume. This implies that SHIB cryptocurrency sellers are attempting to withdraw the token.

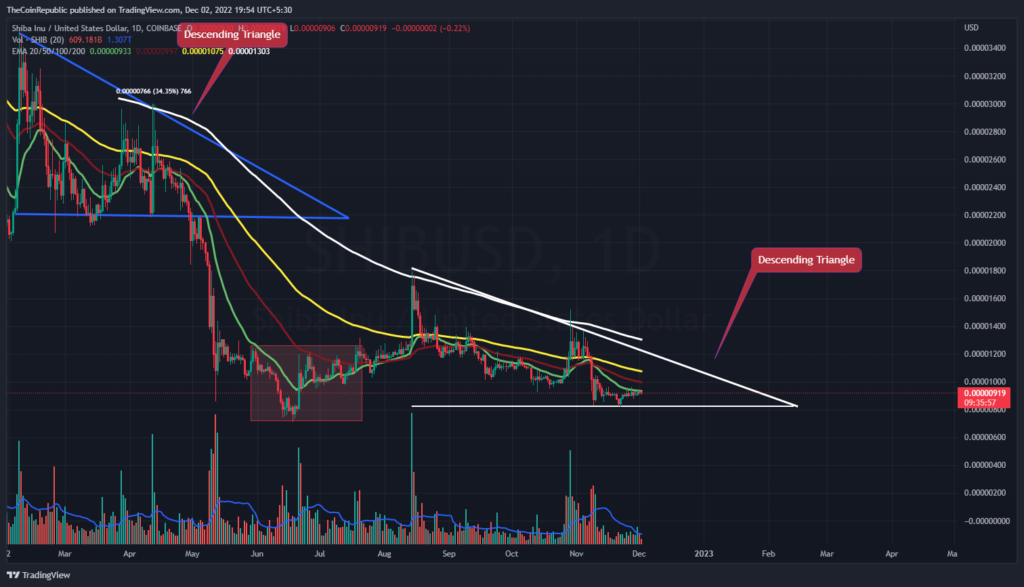
Over the daily price chart, the price of Shiba Inu has been declining through a descending triangle pattern. A fascinating roller coaster ride can be seen on the daily chart for the SHIB cryptocurrency. To break out of the descending triangle pattern, SHIB must increase the volume change, which is now below average and needs to increase.
What do Technical Indicators suggest about SHIB?
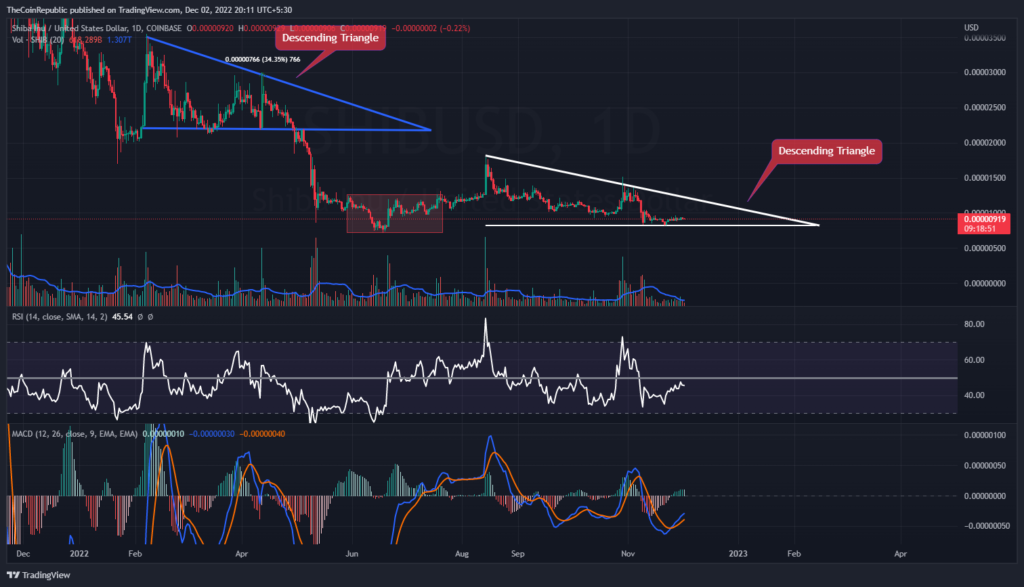
Shiba Inu price needs to break out of the falling triangle formation, and in order for the token to enter its recovery phase, more buyers must come into the market during intraday trading. The token’s decline throughout the daily price chart is supported by technical indicators.
The SHIB cryptocurrency’s downward momentum is displayed by the Relative Strength Index. The RSI is flat below neutrality at 45. The upward momentum of SHIB is visible in MACD. After a positive crossover, the MACD line is ahead of the signal line. The SHIB army must watch for any significant momentum differences in the token’s price movement.
Conclusion
The caged state of the token inside the descending triangle pattern over the daily price chart is suggested by the Shiba Inu price prediction. In order to recover above the daily price chart, SHIb cryptocurrency must get out of its current situation. The SHIB army must wait until the token exits the consolidation state and emerges from the descending triangle pattern in its recovery phase. To break out of the descending triangle pattern, SHIB must increase the volume change, which is now below average and needs to increase. The SHIB army must watch for any significant momentum differences in the token’s price movement.
Technical Levels
Support Levels: $0.00000875 and $0.00000820
Resistance Levels: $0.00000965 and $0.00001050
Disclaimer
The views and opinions stated by the author, or any people named in this article, are for informational ideas only, and they do not establish the financial, investment, or other advice. Investing in or trading crypto assets comes with a risk of financial loss.

With a background in journalism, Ritika Sharma has worked with many reputed media firms focusing on general news such as politics and crime. She joined The Coin Republic as a reporter for crypto, and found a great passion for cryptocurrency, Web3, NFTs and other digital assets. She spends a lot of time researching and delving deeper into these concepts around the clock, and is a strong advocate for women in STEM.


