
 Home
Home News
News

- Ethereum price prediction suggests the faltering position of the second largest cryptocurrency over the daily price chart.
- ETH crypto has slipped below 2o0, 50, 100 and 200-days Daily Moving Average.
- The pair of ETH/BTC is at 0.07382 BTC with an intraday gain of 0.94%.
The second-largest cryptocurrency behind Bitcoin, Ethereum, is attempting to establish support after making a comeback on the daily chart, according tothe Ethereum price prediction. To become stable, the price of an Ethereum coin has to attract more buyers. However, as sellers increase the selling pressure on the coin, the current situation reveals the dashed dreams of ETH investors. To avoid problems and a threshold, the ETH currency price has to obtain support from the bulls. The price of the ETH cryptocurrency is currently attempting to stay above the $1000 level.

The current estimated price of Ethereum is $1250, and on the previous day, the token’s market capitalization increased by about 1.33%. Over the daily price chart, trading volume has declined by 18.55%. This shows that the ETH cryptocurrency escaped the grasp of purchasers and is now under some selling pressure.

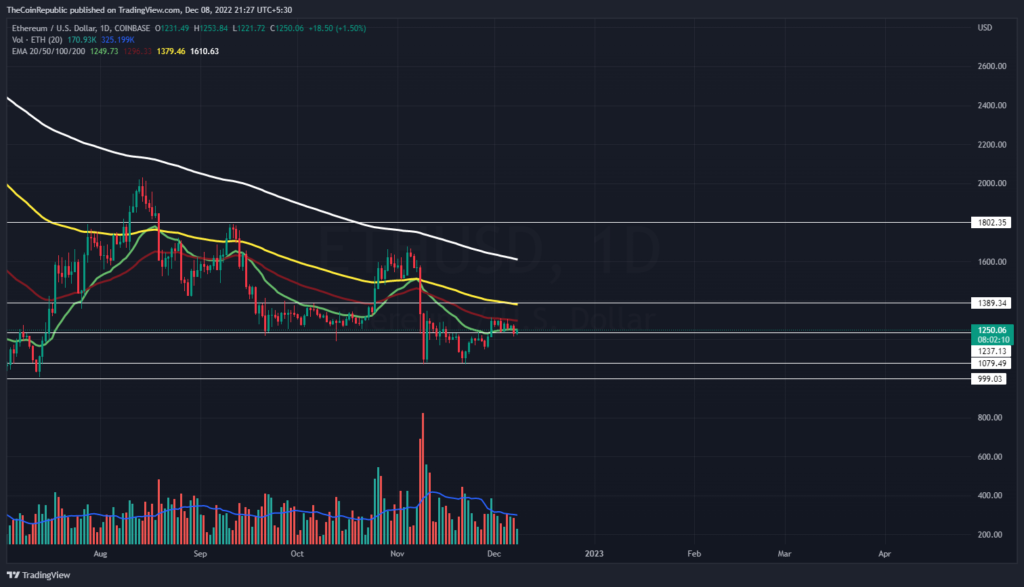
The intraday trading session will need to see an accumulation of bulls as the price of Ethereum attempts to hold above the $1000 level. As soon as the token hit the $1295 barrier mark, the impetus of the ETH cryptocurrency’s ascent was reversed. However, the volume change is below average and needs to be boosted in the direction of the bulls.
Will Ethereum Price (ETH) Recover above 20 EMA?
Technical indicators supporting the Ethereum price prediction show that the cryptocurrency is now in a downturn. To change the token’s current trend, ETH bulls must step ahead. The price of the ETH coin has moved away from the upper band and is now heading in the direction of the baseline.
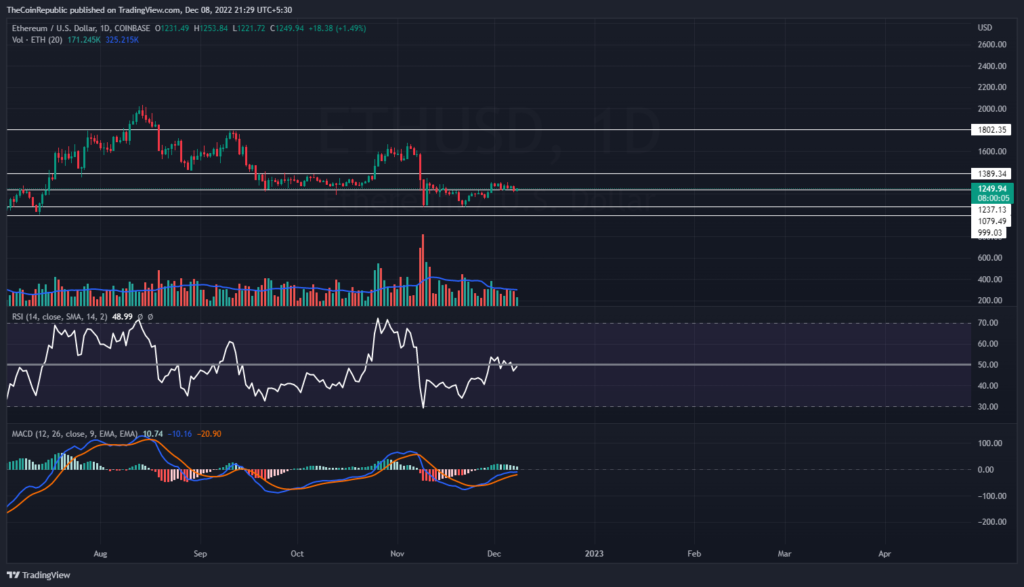
The relative strength index shows how quickly the ETH token is moving upward. The RSI is 49 and moving in the direction of neutrality. The momentum of the ETH coin’s fall is visible on MACD. The MACD line is about to have a negative crossover with the signal line. Investors in ETH must therefore watch the daily price chart for any directional changes.
Conclusion
The second-largest cryptocurrency behind Bitcoin, Ethereum, is attempting to establish support after making a comeback on the daily chart, according to price predictions. To become stable, the price of an Ethereum coin has to attract more buyers. However, as sellers increase the selling pressure on the coin, the current situation reveals the dashed dreams of ETH investors. However, the volume change is below average and needs to be boosted in the direction of the bulls. The MACD line is about to have a negative crossover with the signal line. Investors in ETH must therefore watch the daily price chart for any directional changes.
Technical Levels
Support Levels: $1220 and $1150
Resistance Levels: $1313 and $1500
Disclaimer
The views and opinions stated by the author, or any people named in this article, are for informational ideas only, and they do not establish the financial, investment, or other advice. Investing in or trading crypto assets comes with a risk of financial loss.
Steve Anderson is an Australian crypto enthusiast. He is a specialist in management and trading for over 5 years. Steve has worked as a crypto trader, he loves learning about decentralisation, understanding the true potential of the blockchain.


