
 Home
Home News
News

- Bullish hammer candle formation near Point of Control and value area low (Volume profile)
- AAVE price is down 1.01% on a intraday basis, while the last 24 hours volume traded at 37.56 million
AAVE prices had been sliding down from past couple of days creating lower lows candle formation, recently bears got rejection from $58 levels forming bullish hammer candle indicates the initial phase of short term trend reversal. The volume profile’s value area low also stood at $58 which indicates maximum levels of buyers and sellers in the particular price levels.

Decoding Volume profile
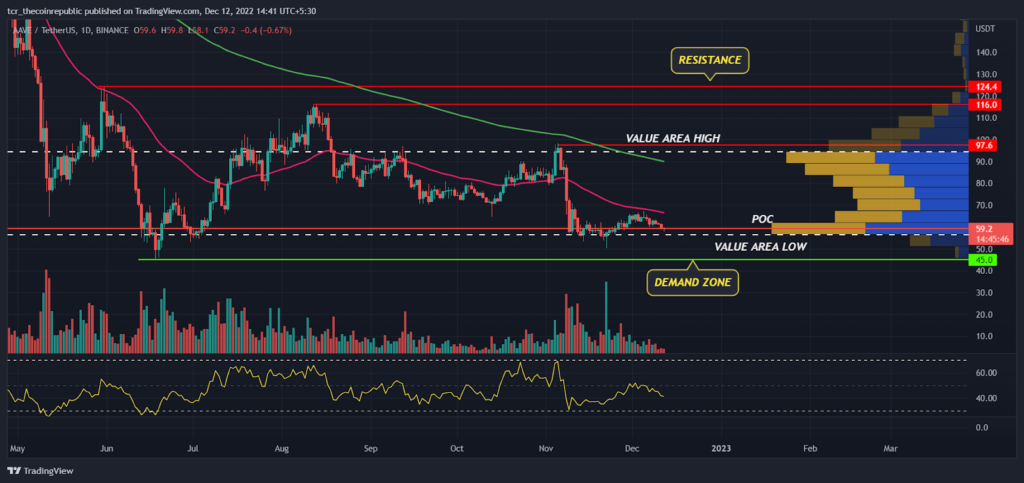
On a higher timeframe, AAVE prices had been very volatile in the past couple of months, Although it has maintained to trade in the range between $45 to $115. From June to August, prices had gained some positive momentum and made a high at $116 but unfortunately bulls were unable to sustain the higher levels, and slipped below $100

Recently, In November, bulls again attempted to trade above $100 but FTX collapse had triggered negative sentiment in the whole crypto industry which also impacted AAVE and dragged the prices further down towards $50.
The 200 day ema (green) sloping downwards indicates prices may remain in downtrend for coming weeks. The 50 day ema(pink) at $66 sloping downwards will act as an immediate hurdle for bulls followed by next resistance at $97. As per volume profile analysis Value area low(VAL) is placed at $56 which will act as demand zone and the Point of control (POC) is near to the same level $59 which creates a confluence area of buyers.
Small time frame narrative

In a lower time frame, AAVE prices are dominated by bears and have been trading in the tight range between $55 to $65. The supertrend indicators had generated a sell signal but it seems risky to build short positions at support levels. As of now prices are trading near support levels at $58, so we may see a strong relief rally in coming days.
Relative Strength Index
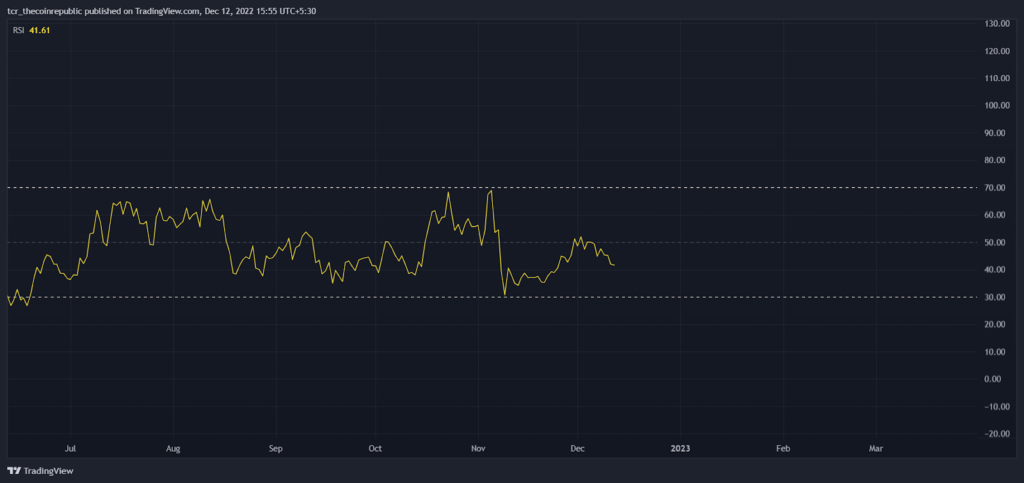
In the mid november RSI had approached oversold levels at 30 and shapely bounced back facing resistance at 50. Currently RSI at 40 pointing sideways indicates price may see upside reversal in coming weeks.
Summary
After analyzing the Volume profile and other indicators AAVE prices are approaching the demand zones and expected to reverse upside in the coming few sessions. Aggressive traders may look for buying opportunities for the target of $70 and above by keeping $55 SL and conservative investors should accumulate AAVE at current levels for the target of $80 and above keeping $45 stoploss.
Technical levels
Resistance levels : $70 and $100
Support levels : $50 – $45
Disclaimer
The views and opinions stated by the author, or any people named in this article, are for informational ideas only, and they do not establish financial, investment, or other advice. Investing in or trading crypto assets comes with a risk of financial loss.

Andrew is a blockchain developer who developed his interest in cryptocurrencies while pursuing his post-graduation major in blockchain development. He is a keen observer of details and shares his passion for writing, along with coding. His backend knowledge about blockchain helps him give a unique perspective to his writing skills, and a reliable craft at explaining the concepts such as blockchain programming, languages and token minting. He also frequently shares technical details and performance indicators of ICOs and IDOs.


