
 Home
Home News
News
- Cardano price prediction has been falling through a descending parallel channel over the daily price chart.
- ADA crypto is trading at 20 EMA but still below 50, 100 and 200-days Daily Moving Average.
- Cardano must maintain the accumulation rate for the token to surge towards the upper trendline of the descending parallel channel.
Cardano price prediction showcases as the daily chart of the Cardano cryptocurrency shows the token’s falling momentum through a parallel descending channel. To return to the upper level, ADA cryptocurrency needs to draw more buyers. On the daily chart, the token has experienced an amusing roller coaster ride, though. Investors in ADA must hold off until the token receives support from the channel’s lower level. The price of the ADA coin must soar back up toward the parallel channel’s upper trendline. In the meantime, the ongoing negative market has significantly impacted the token’s momentum as ADA has been under bearish pressure as a result of additional selloffs.

The current estimated price of Cardano is $0.3142, and in the last day, it has increased by 2.34% in market cap. The intraday trading session has seen a 52.52% increase in trading volume. This demonstrates that buyers are moving in to drive the token up towards the parallel channel’s top trendline.

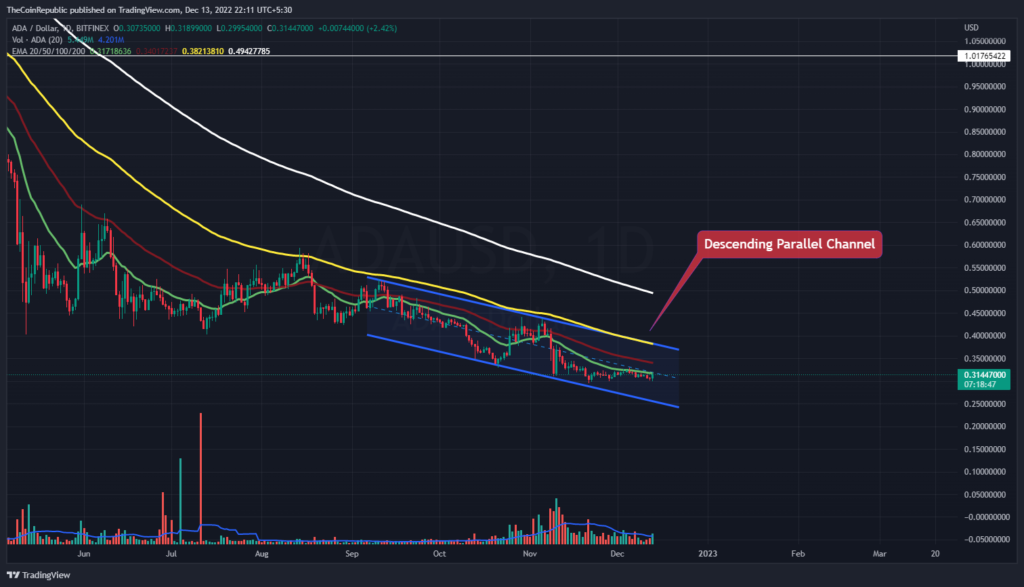
Cardano price prediction points to the ADA cryptocurrency’s decline momentum over the daily price chart. To avoid drastically declining below the parallel channel, ADA crypto must break out of the current falling pattern. The volume change, which is below normal, indicates that the ADA coin price has to draw attention if it is to rise toward the upper trendline. However, ADA crypto is trading at 20 EMA but still below 50, 100 and 200-days Daily Moving Average.
What do Technical Indicators suggest about Cardano Price?
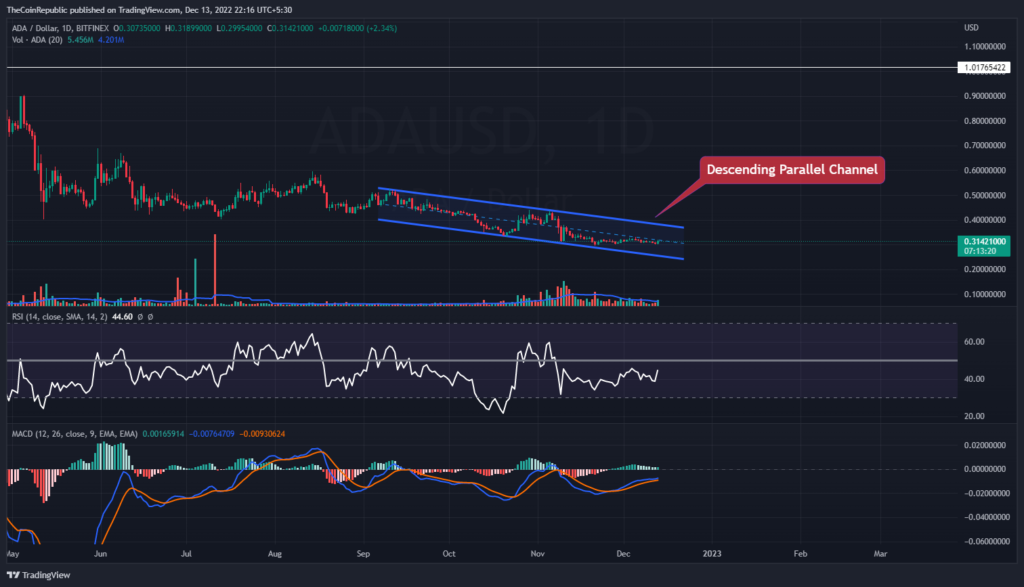
The ascending parallel channel’s top trendline must be reached by the Cardano price. Technical signs indicate that ADA is likely to push since MACD is about to cross over to the upside.
The relative strength index highlights the ADA cryptocurrency’s upward momentum. At 39, the RSI is moving in the direction of neutrality. The ADA coin’s upward momentum is visible on the MACD. A positive crossover is set to occur between the MACD line and the signal line upward.
Conclusion
Cardano price prediction showcases as the daily chart of the Cardano cryptocurrency shows the token’s falling momentum through a parallel descending channel. To return to the upper level, ADA cryptocurrency needs to draw more buyers. On the daily chart, the token has experienced an amusing roller coaster ride, though. The volume change, which is below normal, indicates that the ADA coin price has to draw attention if it is to rise toward the upper trendline. Technical signs indicate that ADA is likely to push since MACD is about to cross over to the upside.
Technical Levels
Support Level: $0.30 and $0.28
Resistance Level $0.34 and $0.40
Disclaimer
The views and opinions stated by the author, or any people named in this article, are for informational ideas only, and they do not establish the financial, investment, or other advice. Investing in or trading crypto assets comes with a risk of financial loss.

Nancy J. Allen is a crypto enthusiast, with a major in macroeconomics and minor in business statistics. She believes that cryptocurrencies inspire people to be their own banks, and step aside from traditional monetary exchange systems. She is also intrigued by blockchain technology and its functioning. She frequently researches, and posts content on the top altcoins, their theoretical working principles and technical price predictions.


