
 Home
Home News
News

- Dogecoin price prediction suggests that the token has been consolidating inside the long term consolidation phase over the daily price chart.
- DOGE crypto is currently trading below 20, 50, 100 and 200-days Daily Moving Average.
- The pair of DOGE/BTC is at 0.000004659 BTC with an intraday drop of 3.57%.
Dogecoin price prediction indicates that the token is trying to return from the lower trendline at $0.075 over the daily price chart. DOGE investors need to wait until bulls push their limit for the token to start its bullish rally over the daily price chart. Dogecoin price must surge towards the upper price range of the consolidation phase over the daily price chart. The accumulation rate needed to be increased during the intraday trading session. However, volume change is still not up to the mark and it must increase up to desired level.

Dogecoin price is currently approximated at $0.0778 and has lost 4.95% of its market capitalization in the last 24-hour period. However, trading volume has increased by 36.72% during the intraday trading session. This demonstrates that buyers are trying to approach for the token to surge towards the upper price range of the consolidation phase. Volume to market cap ratio is 0.06899.

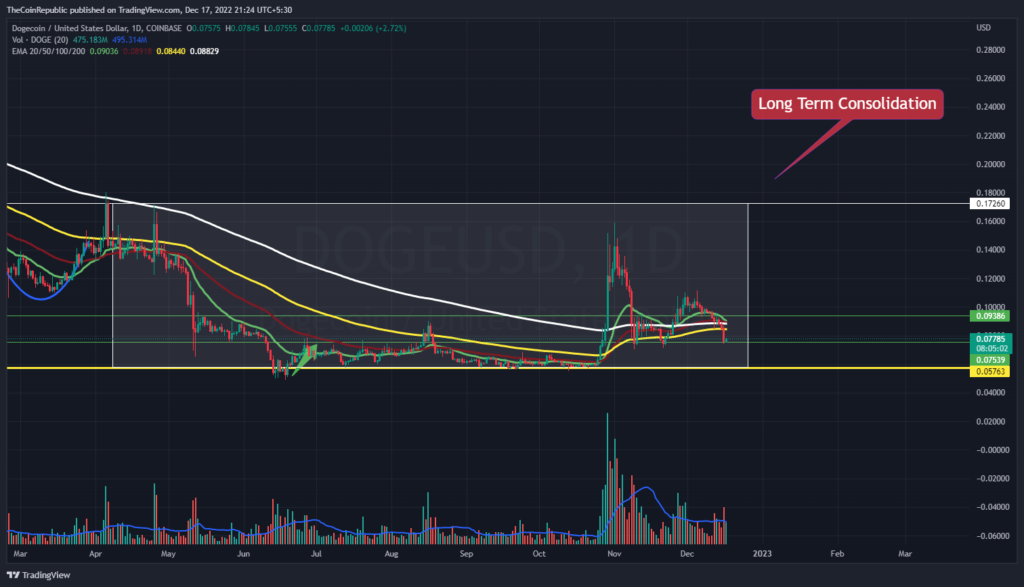
Dogecoin price prediction suggests the consolidation phase of the token over the daily price chart. However, volume change can be seen below average and needs to grow for DOGE to bark and run towards the upper price range over the daily price chart. Meanwhile, DOGE crypto is currently trading below 20, 50, 100 and 200-days Daily Moving Average. Dogecoin price has dropped around 19.51% in a week and 8.86% in the last month.
Will Dogecoin Price Maintain these Bullish Sentiments?
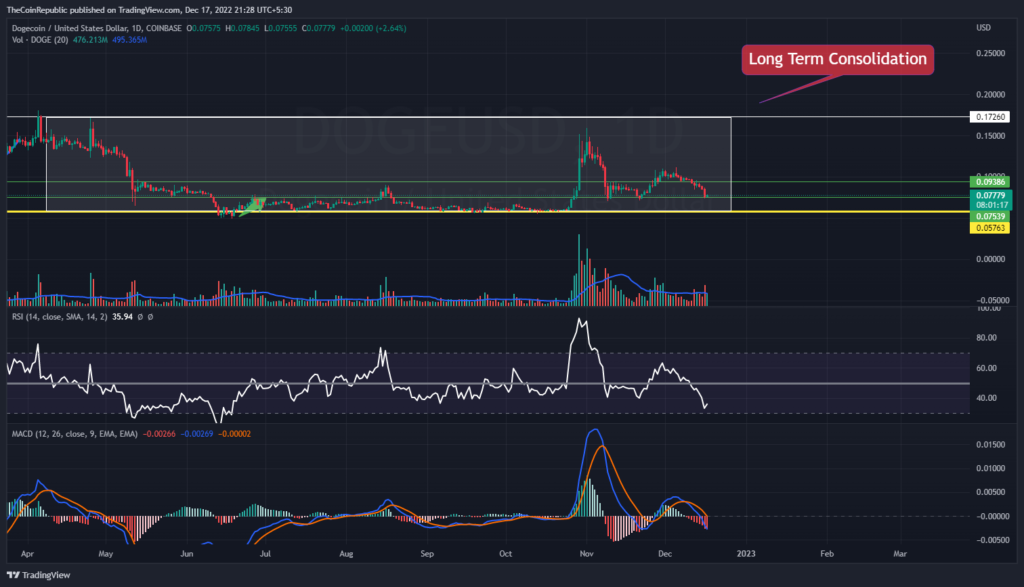
Technical indicators suggest the token’s trend reversal over the daily price chart. Relative Strength Index showcases the uptrend momentum of DOGE crypto. RSI is at 35 and is returning towards neutrality. However, MACD exhibits the downtrend momentum of DOGE cryptocurrency. The MACD line is below the signal line after a negative crossover. DOGE investors need to wait for any directional change over the daily price chart.
Conclusion
Dogecoin price prediction indicates that the token is trying to return from the lower trendline at $0.075 over the daily price chart. DOGE investors need to wait until bulls push their limit for the token to start its bullish rally over the daily price chart. Dogecoin price has dropped around 19.51% in a week and 8.86% in the last month. However, MACD exhibits the downtrend momentum of DOGE cryptocurrency. DOGE investors need to wait for any directional change over the daily price chart.
Technical Levels
Support Levels: $0.070 and $0.060
Resistance Levels: $0.095 and $0.105
Disclaimer
The views and opinions stated by the author, or any people named in this article, are for informational ideas only, and they do not establish financial, investment, or other advice. Investing in or trading crypto assets comes with a risk of financial loss.

With a background in journalism, Ritika Sharma has worked with many reputed media firms focusing on general news such as politics and crime. She joined The Coin Republic as a reporter for crypto, and found a great passion for cryptocurrency, Web3, NFTs and other digital assets. She spends a lot of time researching and delving deeper into these concepts around the clock, and is a strong advocate for women in STEM.


