
 Home
Home News
News

- eBay share price is showing down 9.8% in last 30 days.
- Sellers found resistance at the 0.236 level of the Fib retracement.
- The stock is priced near $40, which can act as a support.
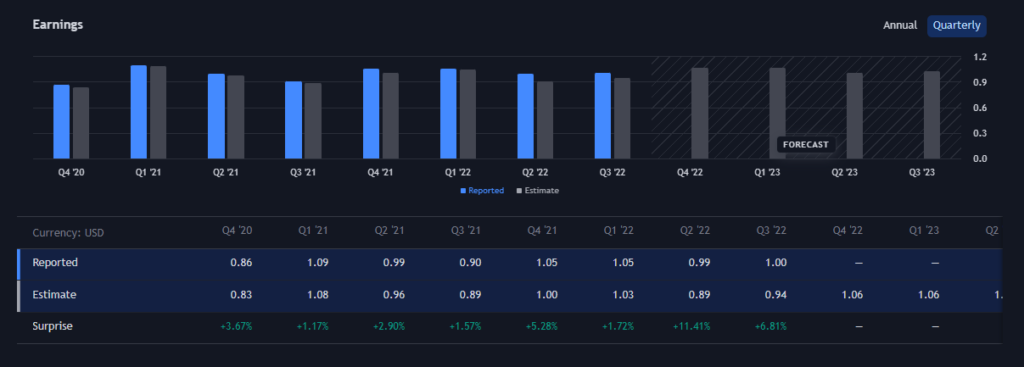
American multinational e-commerce company – eBay looks good for long term investment as the asset company has performed well in last few quarterly results. The earnings for the fourth quarter of FY20 so far (chart below) surprised investors. Buyers can look at the eBay stock price from the earnings and revenue side.

In the letter of Friday 16 December, the eBay stock price plunged 3.05% in a day. This week was unprofitable for the buyers as they saw 6.05% decline in week while asset price closed at $41 mark at the end of day.

On Technical Chart, eBay Stock Price Shows Another Story
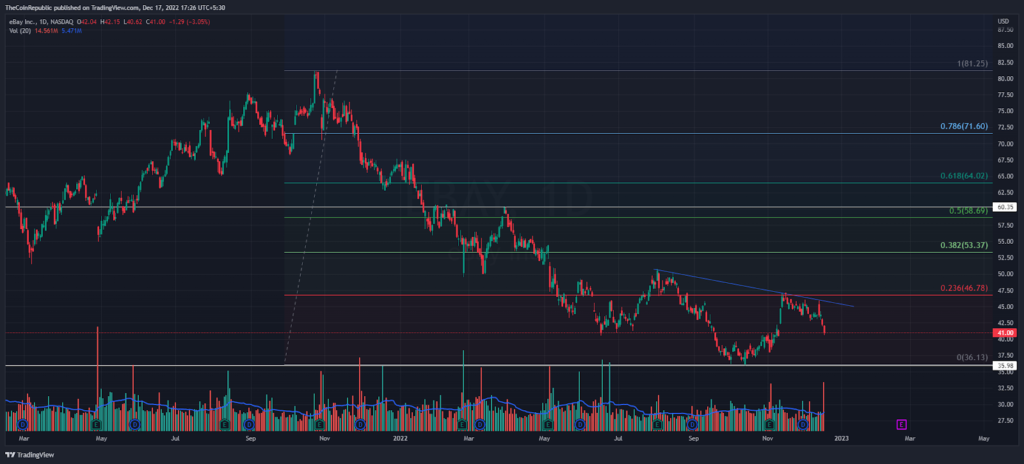
However, eBay stock has continued to decline from its all-time high of $81.19. From this resistance, buyers lost about 55% of the cost until it formed a yearly low of $35.92 on October 10. Later, the shoppers witnessed the roller-coaster ride. The price action is suggesting further downside as the sellers found resistance at the 0.236 level of the Fibonacci retracement level.
Trading volumes also increase during the retracement phase, which is not good for investors. Over the weekend, the volume was reported at 35.2 million, which was higher than the average trading volume. This aggressive selling could lead to a decline to yearly lows.
Weekly Chart of eBay Stock Price
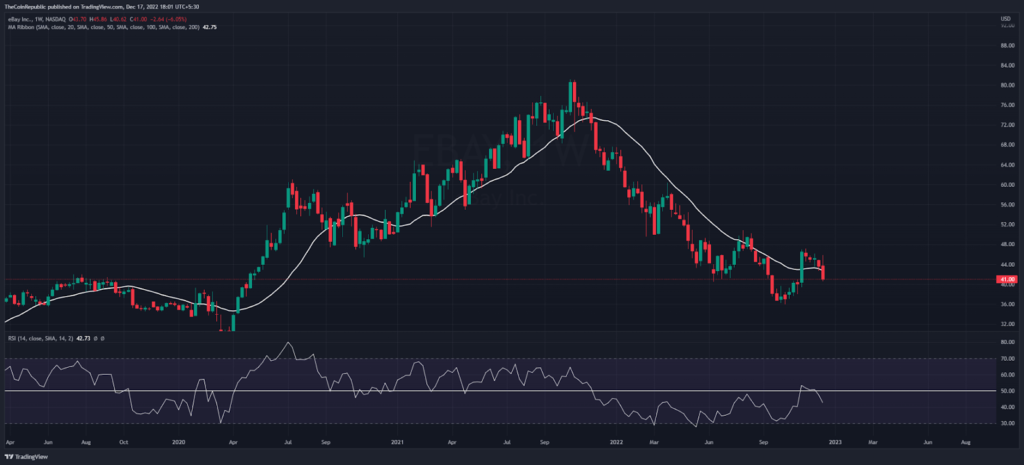
eBay stock price turned bearish because bears have closed the weekly price candle below 20 simple moving average. This retracement phase may occur until the next support level. In addition, weekly RSI decreased below semi-line.
Conclusion
The eBay stock price trend caught by sellers as the weekly price chart traded below the 20 simple moving average. This selling may take a pause at the annual bottom level.
Support level – $40 and $35
Resistance level – $47 and $60
Disclaimer
The views and opinions stated by the author, or any people named in this article, are for informational ideas only, and they do not establish financial, investment, or other advice. Investing in or trading crypto assets comes with a risk of financial loss.

Andrew is a blockchain developer who developed his interest in cryptocurrencies while pursuing his post-graduation major in blockchain development. He is a keen observer of details and shares his passion for writing, along with coding. His backend knowledge about blockchain helps him give a unique perspective to his writing skills, and a reliable craft at explaining the concepts such as blockchain programming, languages and token minting. He also frequently shares technical details and performance indicators of ICOs and IDOs.


