
 Home
Home News
News

- Quant prices reversing down, after rejecting 50 and 200 day ema, whereas RSI reversing up from after hitting 40 level.
- QNT trading near the demand zone and responsive buyers will try to reverse the ongoing down trend.
Quant prices had reacted positively in the past couple of months and had been able to generate decent returns for investors but currently it is stuck in sideways movement and likely to retest $100 again. As of now, QNT/USDT is trading mild negative and down by 0.36% on a intraday basis and 24 hour volume to market cap ratio stood at $0.023

Will the Quant be able to bounce back from the demand zone ?
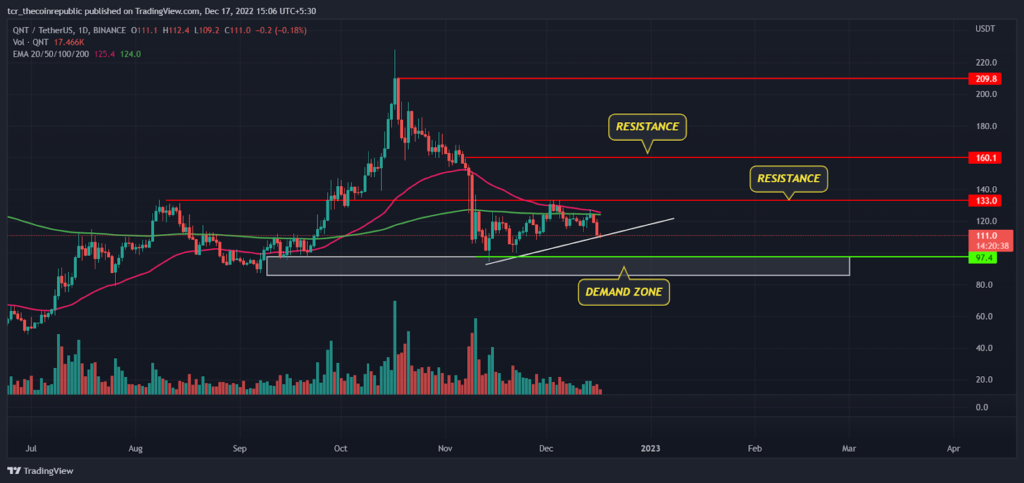
On a higher time frame Quant prices are in an uptrend but due to an unfavorable environment in the whole crypto industry, buyers are struggling to keep the QNT prices above 200 and 50 day exponential moving averages. In the end of September, prices gained positive momentum from the support zone of $100 and rallied almost 110% in a short span of time. Later it faced resistance at $209.8 and bears succeeded to drag the prices back to its previous support zone.

As of now prices are trading sideways in the range between $97 to $133 and likely to gain momentum if bulls succeed to defend the demand zone of $100 but in this uncertainty if prices slipped below $85 we may see further downside towards $80 and below. On the higher side immediate hurdle fo bulls will be $133 followed by next resistance will be $160
The closer window
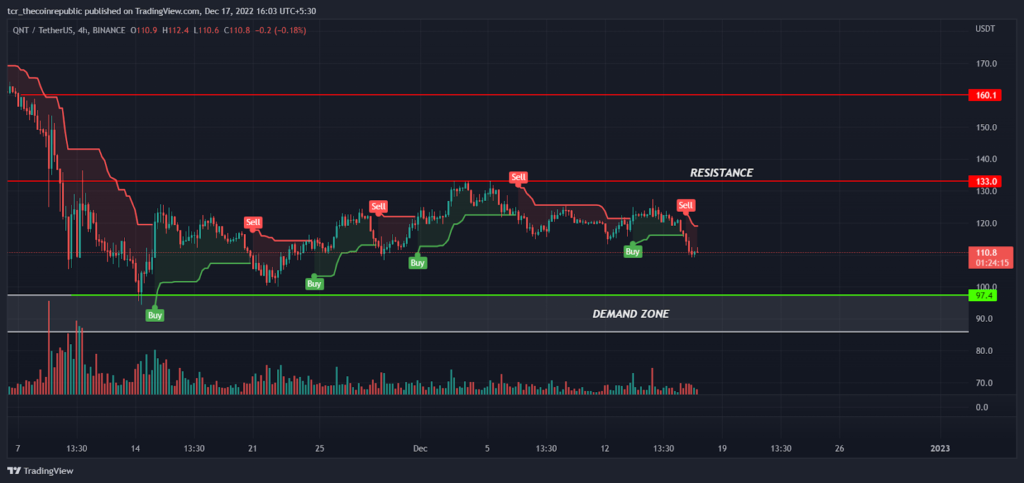
On a lower time frame, prices are trading in a consolidation range between $97 to $133. Recently, a few weeks ago bulls attempted to break out of the higher range but got rejected and currently, prices are reversing downside and likely to approach the demand zone again. However, The super trend indicator has generated a sell signal which indicates the short term trend may remain weak till the prices are trading below the red line and prices may witness a little more selling pressure from higher levels.
Divergence in MACD and Relative Strength Index
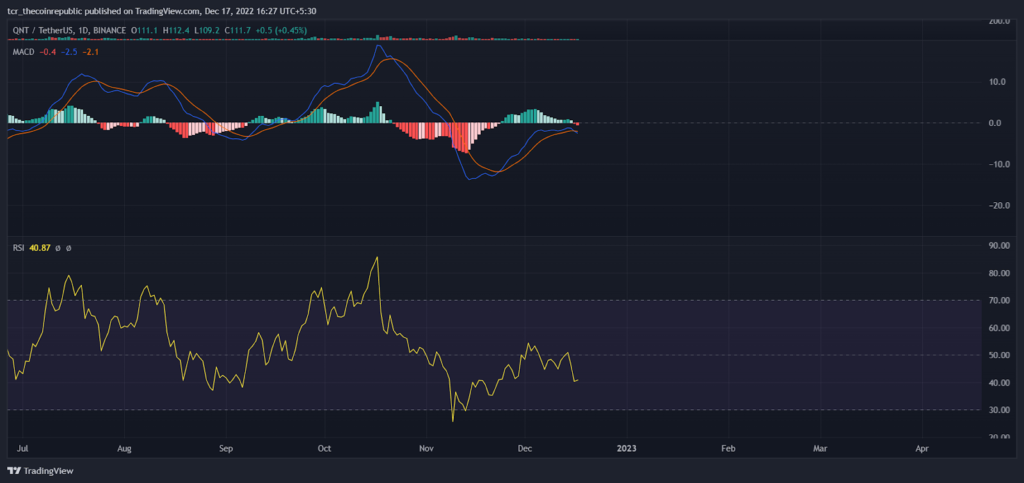
MACD had been quite positive in the past few weeks as green histogram bars are getting deep indicating strength in prices but as of now MACD changed its direction and is likely to negatively cross the signal line (red) which may be the initial phase of minor correction. The RSI had tested 40 and sloping sideways indicates prices may see some reversal from the lower levels.
Summary
QNT prices had performed quite well as compared to its other peers but due to the negative environment in the whole crypto market, buyers are reluctant to buy QNT on higher levels. As per technical analysis, prices may test $100 levels before moving up so aggressive traders must take this declining opportunity to build long positions near the demand zone for the target of $130 and above by keeping $85 as SL.
Technical levels
Resistance levels : $133.00 and $160.00
Support levels : $97.00 and $85.00
Disclaimer
The views and opinions stated by the author, or any people named in this article, are for informational ideas only, and they do not establish financial, investment, or other advice. Investing in or trading crypto assets comes with a risk of financial loss.

Nancy J. Allen is a crypto enthusiast, with a major in macroeconomics and minor in business statistics. She believes that cryptocurrencies inspire people to be their own banks, and step aside from traditional monetary exchange systems. She is also intrigued by blockchain technology and its functioning. She frequently researches, and posts content on the top altcoins, their theoretical working principles and technical price predictions.


