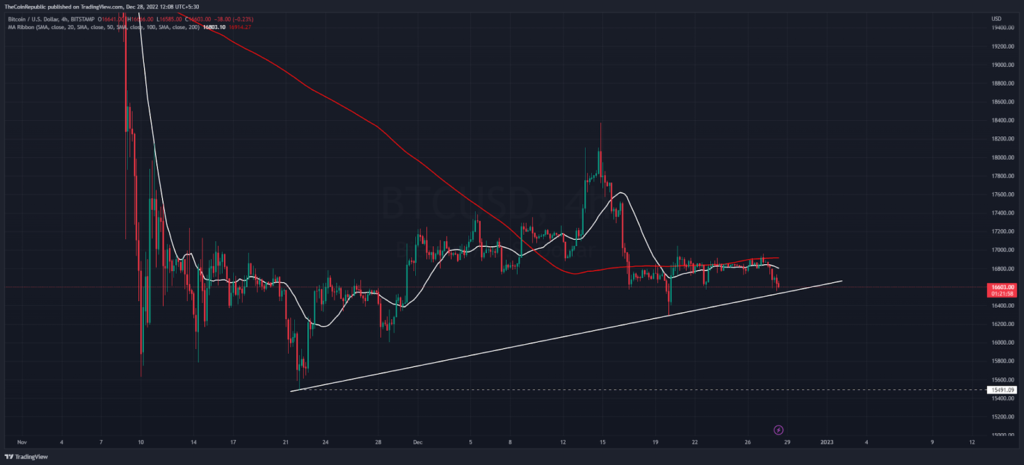
- Bitcoin price brokedown the sideways range after six trading days.
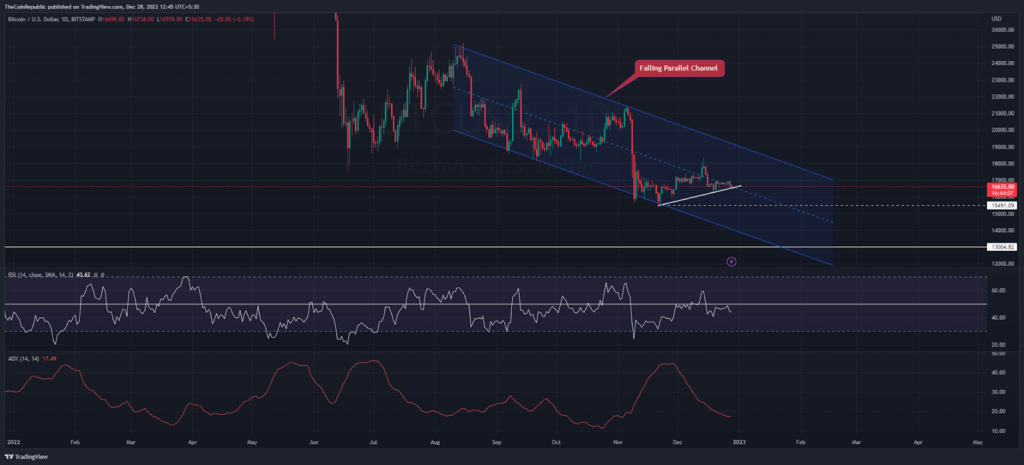
- Price action represents a bearish channel in the daily price chart.
- Bears are often denied for higher price momentum near $17,000 resistance.
Bitcoin price begins downwards momentum while it reaches seven days lower level of $16,570 in intraday trading session. This bearish momentum occurs after the consolidation phase, so buyers may face trouble ahead if Bitcoin price slips below next horizontal support levels.
At press time, Bitcoin price against the USD bids at $16,600 along with 0.0.57% intraday drop. Bearish momentum started last night when BTC slipped below $16,730 mark. As of now short-sellers took control over the world’s largest cryptocurrency.
Bitcoin Price Prediction on 4 Hour Chart
On the 4 hour price chart, Bitcoin price (BTC) reaches a support trendline (white). Buyers must hold this level to defend themselves from sharp decline towards annual bottom level. More uncertainty increases as the 200 simple moving average stays above the 20 SMA in near term. Unfortunately, buyers have to struggle a lot to up-lift BTC above 200 SMA (red).
However, Bitcoin looks under bulls’ control as long they maintain an ascending trendline on hourly chart. Aside from price action, market capitalization decreased 1.45% in the last 24 hours, reported at $320.28 Billion as per CMC. As a result, again overall crypto market capitalization plunged today lower than $800 billion.
Bitcoin Price Prediction on Daily Chart
On the daily price scale, bitcoin price has so far remained inside a descending parallel channel. BTC is slowly slipping below the midline of this bearish pattern and is expected to further support the trendline.
The daily RSI consolidated just below the semi-line and started moving lower. At the same time, the ADX indicator is seen below the 20 mark, suggesting weak downside momentum, so buyers have an opportunity to make a move.
Conclusion
When we talk about bitcoin price prediction, there is still uncertainty in the market as far as long term aspects are concerned. But on a short note, buyer
have an opportunity to reverse Bitcoin’s lower momentum above the ascending trendline.
Support level – $15480 and $14,000
Resistance level – $18,000 and $20,000
Disclaimer
The views and opinions stated by the author, or any people named in this article, are for informational ideas only, and they do not establish financial, investment, or other advice. Investing in or trading crypto assets comes with a risk of financial loss.

Andrew is a blockchain developer who developed his interest in cryptocurrencies while pursuing his post-graduation major in blockchain development. He is a keen observer of details and shares his passion for writing, along with coding. His backend knowledge about blockchain helps him give a unique perspective to his writing skills, and a reliable craft at explaining the concepts such as blockchain programming, languages and token minting. He also frequently shares technical details and performance indicators of ICOs and IDOs.


 Home
Home News
News


