
 Home
Home News
News

When Bitcoin touched its all-time high of around $68,789.63 on November 10, 2021, everyone thought that 2022 would be at a higher point, if not more than this high. But crypto winter, Terra ecosystem and FTX collapse caused the whole crypto market to go into a deep slumber, from which there are no signs of waking up anytime soon. However, a famous crypto analyst Michael van de Poppe, took to Twitter to share insights into his price analysis.

Lite Coin (LTC) Analysis
LTC is currently trading at $75.63 with a rise of 8.15%, its value remains at 0.004518 BTC with a rise of 6.72%, its market cap saw a jump of 8.17% at $5.4 billion, and its volume is at $579 million with a massive jump of 43.38%. The current rate is 81.73%, down from its all-time high of $412.96 as of May 10, 2021, and 6,674.20%, up from an all-time low of $1.11 as of January 14, 2015. At the same time, its market dominance remains at 0.67%, with rank #12.

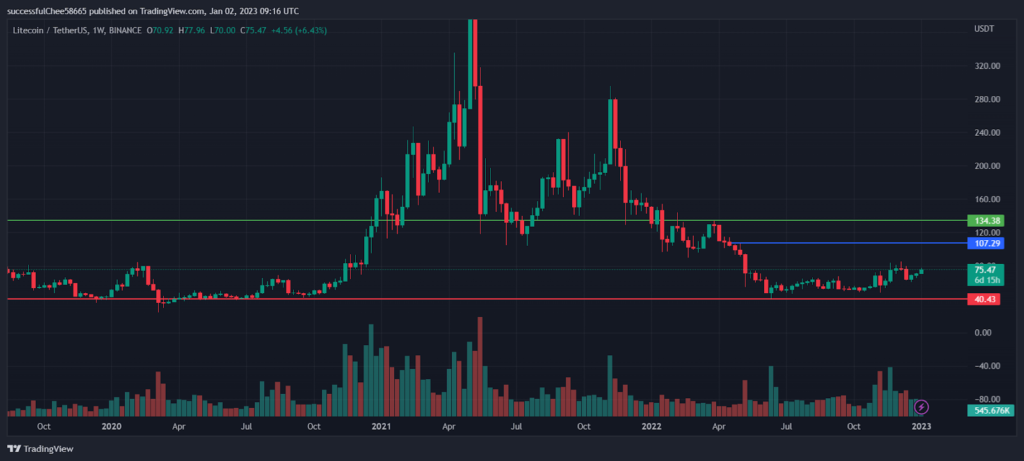
The chart shows a slight upward trend and seems to be moving between the 107.29 and 40.43 zone for a while and might break northward to respect resistance at 134.38.
Fantom (FTM) Analysis
Currently trading at $0.2062 with a 3.45% jump, value against 0.000011232 BTC with a 2.14% jump. Market cap rose by 3.49% at $570 million, while volume jumped by 50.70% at $4.0 million. Market dominance was at 0.07%, ranking at 61. The current value is 94.08%, down from an all-time high of $3.48 as of October 28, 2021, and up by a massive 10,457.64% from an all-time low of $0.001953 as on March 13, 2020.
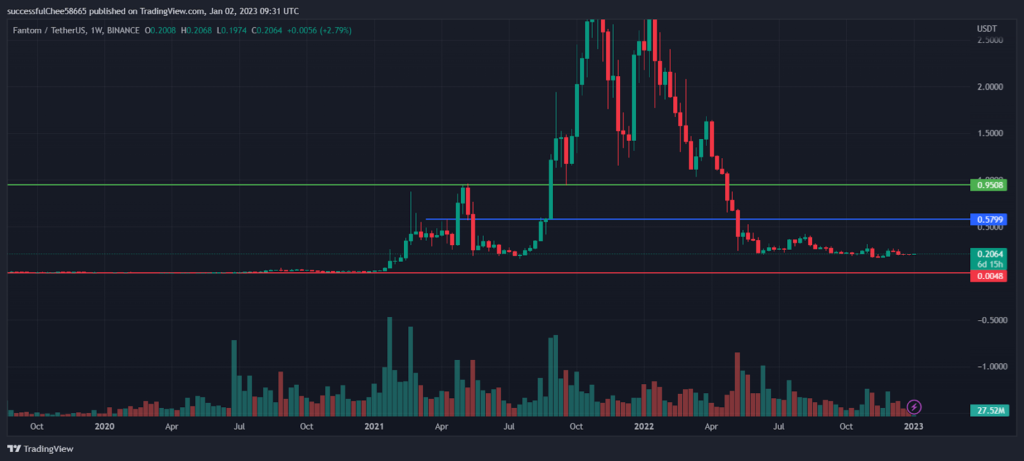
The market seems to be horizontal, expected to move in a zone between 0.5799 and 0.0048. If in case it breaks out, it shall find resistance at 0.9508.
Fetch.ai (FET) Analysis
Currently trading at $0.0953 and up by 4.27%. Valued at 0.00005697 BTC with a jump of 3.02%, market cap rose by 4.24% at $78 million, and volume saw a jump of 30.04% at $7 million. Ranking at 186. The current rates are down by 91.95% from an all-time high of $1.19 as of September 8, 2021, and up by 1,574.4% from an all-time low of $0.00827 on March 13, 2020.
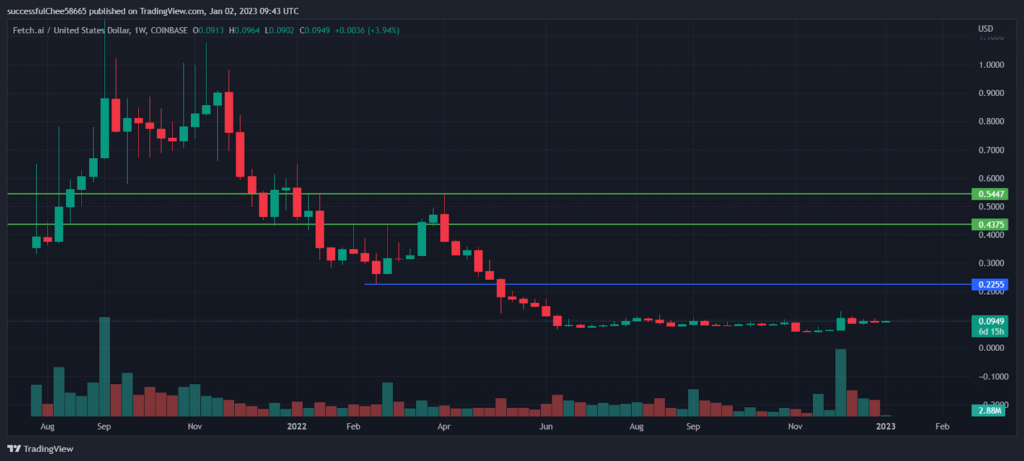
A relatively new chart shows it to be in a horizontal zone and might rise to 0.2255, might move in a zone of 04375 and 0.2255 before going north to respect 0.5447.
All this analysis indicates ongoing horizontal movement in the market; however considerable rise in volumes in the last 24 hours shows that users are getting into the market, and there are hopes for a better 2023.

With a background in journalism, Ritika Sharma has worked with many reputed media firms focusing on general news such as politics and crime. She joined The Coin Republic as a reporter for crypto, and found a great passion for cryptocurrency, Web3, NFTs and other digital assets. She spends a lot of time researching and delving deeper into these concepts around the clock, and is a strong advocate for women in STEM.


