
 Home
Home News
News

- TRON shows bearish actions in the previous sessions.
- The pair of TRON/USD is trading at the price level of $0.053 with a decrease of -0.22% in the past 24 hours.
Tron token had a small bounce in late October as the blockchain announced a new collaboration with the Huobi (HT) Heco network. Since then, the market has slowed and reached new lows. TRON recently bounced off its support level, which is a key support level since bears have not been able to force the price of the token below this level for a long time.

TRON on the daily chart shows signs of bullish momentum
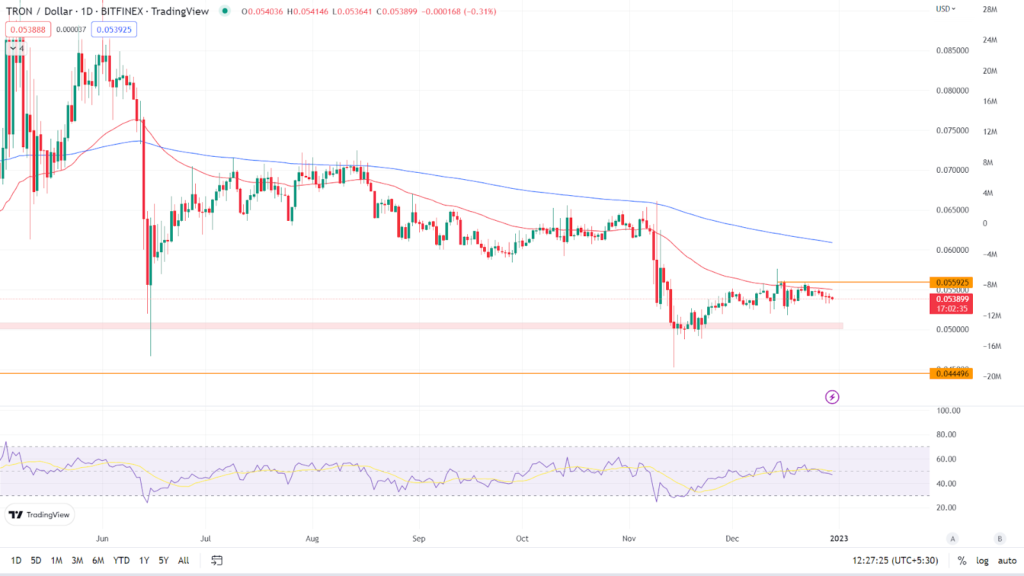
Unlike any other cryptocurrency, TRON token was also in a downtrend, forming lower highs and lower lows. TRON is presently trading at $0.053 with a loss of -0.22%, as shown on the daily chart. Price is now trading below its 50 and 200 EMA moving averages. (Red line is 50 EMA and the blue line is 200 EMA). Token has recently rebounded from a crucial support level and is now encountering resistance near the 50 EMA.

Relative Strength Index: The asset’s RSI curve is presently trading at 47.16, just below the 50-point level. Because of the bullish momentum, the RSI curve has recovered from the oversold zone. The RSI curve has crossed the 14 SMA downward reason being the price facing resistance near the 50 EMA. If the price crosses the 50 EMA and stays above it, the RSI curve value may reach the halfway mark of 50, indicating bullish momentum.
Analyst view & Expectations
Price has shown signs of bullish momentum, but is now encountering resistance at the 50-day moving average. We cannot proclaim the Token’s downtrend over until the price crosses the 50 and 200 EMA. Retail investors should hold their buying until the price crosses the EMAs. Intraday traders have an excellent chance to go short if the price breaks the $0.050 level and reaches the $0.044 target.
According to our current TRON price forecast, the value of TRON is expected to fall by -0.27% and hit $ 0.053939 in the next few days. Our technical indicators indicate that the current sentiment is bearish, with the Fear & Greed Index reading 28. (Fear). TRON had 15/30 (50%) green days in the previous 30 days, with 1.17% price volatility. According to our TRON forecast, now is not the time to buy TRON.
Technical Levels
Major support: $0.050
Major resistance: $0.055
Conclusion
The TRON token is showing signs of bullish momentum, but it still needs to break through an important resistance level to shift the trend. Investors are advised to wait for further clarification on the trend’s direction.
Disclaimer: The views and opinions stated by the author, or any people named in this article, are for informational ideas only, and they do not establish the financial, investment, or other advice. Investing in or trading crypto assets comes with a risk of financial loss.

With a background in journalism, Ritika Sharma has worked with many reputed media firms focusing on general news such as politics and crime. She joined The Coin Republic as a reporter for crypto, and found a great passion for cryptocurrency, Web3, NFTs and other digital assets. She spends a lot of time researching and delving deeper into these concepts around the clock, and is a strong advocate for women in STEM.


