
 Home
Home News
News
- Pfizer Share price has showcased some promising trading factors as it crossed 16% growth rate during this quarter.
- Pfizer Inc. (NYSE: PFE) is up 41% in the last five years, also slightly above the market returns.
- On the contrary, PFE stock has slipped around 12.41% year to date.
Pfizer share price went through some interesting patterns over the daily time frame chart. Pfizer has been a good investment since the Covid outbreak all around the globe as it’s one of the greatest manufacturers of pharmaceutical and biotechnological assets.

PFE stock price at first went into a V shaped recovery pattern as from August 2022 it started falling over the daily time frame chart and then fell till $41 finally got support in October 2022. Surged with some great spikes through October, November and December 2022 closing the year with some significant recovery over the daily time frame chart.

In the meantime, Pfizer share price grown above 20, 50, 100 and 200-days Daily Moving Average. However, by the beginning of January 2023, Pfizer stock price lost its accumulation rate and is still faltering to gather support after losing the accumulation.
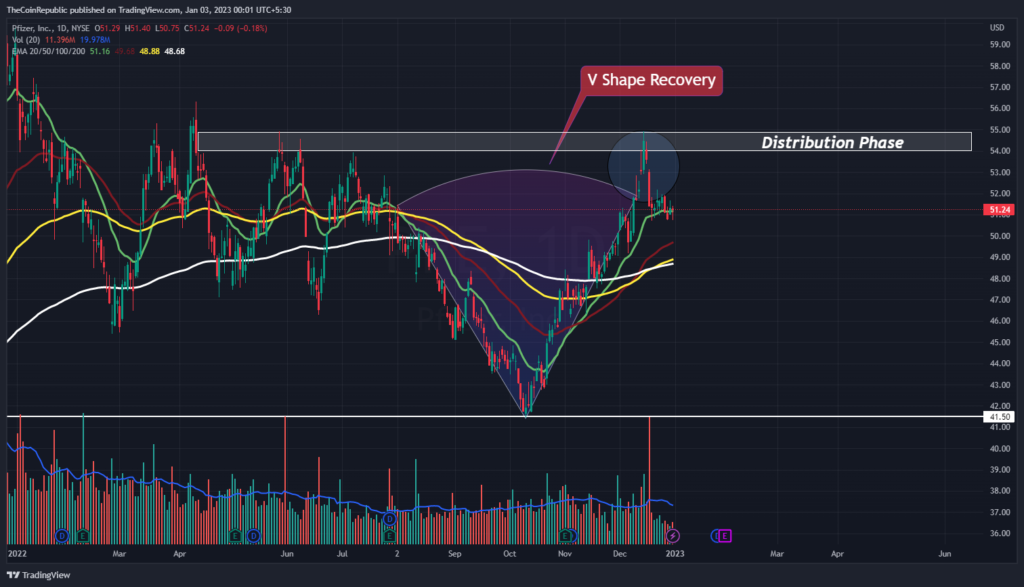
Pfizer share price has grown dramatically over the daily time frame chart and got distributed from the distribution phase marked at $55. PFE stock price is currently trying to reverse the trend as it got distributed from $55 and is now trying to sustain above $50 over the daily time frame chart.
Pfizer stock price is trying to sustain at 20-EMA and is trading above 50, 100 and 200-days Daily Moving Average. However, volume change is below average and needs to grow for PFE to surge back towards the distribution phase.
Pfizer Share Price: Exclusive Technical Analysis
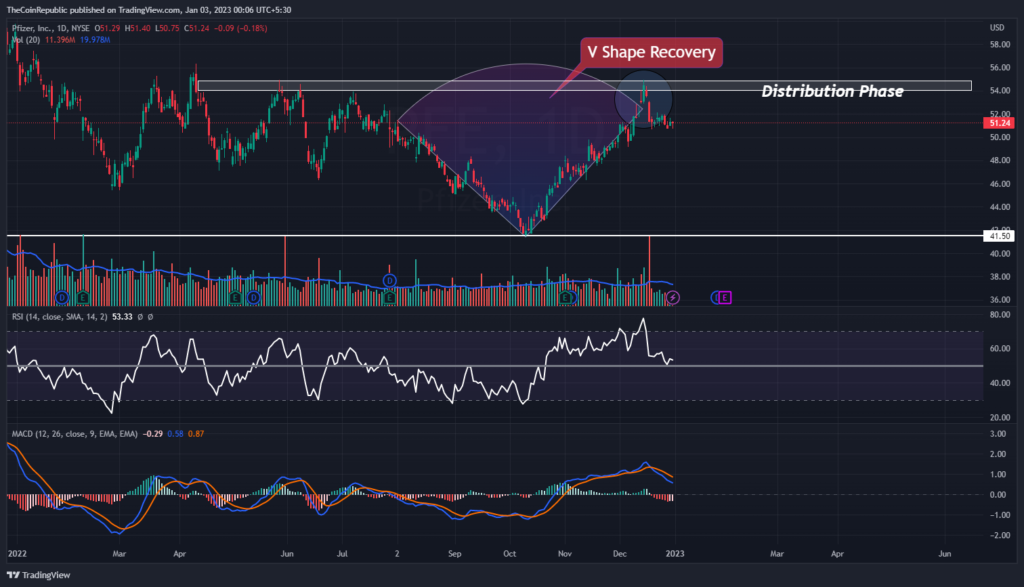
Technical indicators suggest that Pfizer share price is slipping over the daily time frame chart. Relative Strength Index showcases the downtrend momentum of PFE stock. RSI is at 53 and is trying to sustain above neutrality. MACD exhibits the downtrend momentum of PFE stock price. The MACD line is below the signal line after a negative crossover. Investors in Pfizer Inc. (NYSE: PFE) needs to wait until the stock price sustains above $50.
Summary
Pfizer share price went through some interesting patterns over the daily time frame chart. PFE stock price at first went into a V shaped recovery pattern as from August 2022 it started falling over the daily time frame chart and then fell till $41 finally got support in October 2022. Pfizer share price has grown dramatically over the daily time frame chart and got distributed from the distribution phase marked at $55. Technical indicators suggest that Pfizer share price is slipping over the daily time frame chart. Investors in Pfizer Inc. (NYSE: PFE) needs to wait until the stock price sustains above $50.
Technical Levels
Support Levels: $50.00 and $47.60
Resistance Levels: $52.00 and $55.00
Disclaimer
The views and opinions stated by the author, or any people named in this article, are for informational ideas only, and they do not establish financial, investment, or other advice. Investing in or trading crypto assets comes with a risk of financial loss.

Andrew is a blockchain developer who developed his interest in cryptocurrencies while pursuing his post-graduation major in blockchain development. He is a keen observer of details and shares his passion for writing, along with coding. His backend knowledge about blockchain helps him give a unique perspective to his writing skills, and a reliable craft at explaining the concepts such as blockchain programming, languages and token minting. He also frequently shares technical details and performance indicators of ICOs and IDOs.


