
 Home
Home News
News

- Apecoin Crypto price took support at $3.500 and formed a strong bullish candle
- The MACD had generated positive crossover and RSI above 50 indicates strength in prices.
Apecoin Crypto price is trading with mild bullish cues and bulls are trying to reverse the short term trend in the favor of bulls. In the previous week APE prices were up by 7.65% and likely to continue the positive movement in coming days. Currently, APE/USDT is trading at $3.877 with the intraday gains of 0.23% and 24 hour volume to market ratio stood at 0.1072

Will Apecoin be able to defend the recent lows ?
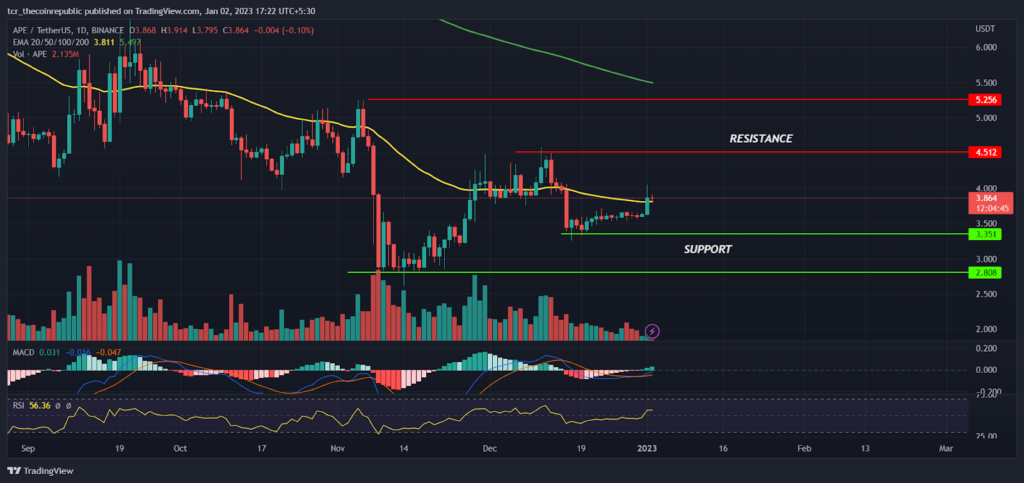
On a daily time frame, Apecoin prices are quite volatile and bulls have tried multiple times to trade above 50 day EMA but due to strong sellers on higher levels, bear’s succeed to drag the prices down back to its support zones. In the mid of November, prices hit a low at $2.618 and formed a bullish hammer candle which led the prices to gain some positive momentum and recovered almost 60% from the lows. Later, prices faced resistance at $4.512 and slipped below the $4.000 levels.

The 200 day ema (green) sloping down indicates a trend to remain weak on a positional basis. However, if prices are able to sustain the 50 day EMA (yellow) at $3.811 me may witness some meaningful upside recovery in coming weeks. As of now, the immediate resistance for Ape traders will be at $4.512 followed by next will be $5.256. On a lower side $3.350 will act as immediate support for bulls and if prices slipped below $3.350 bear’s drag the prices down towards $2.808 The MACD had generated positive crossover indicates bullishness may continue in coming days and the RSI at 56 denotes strength in prices.
Short term relief rally possible ?
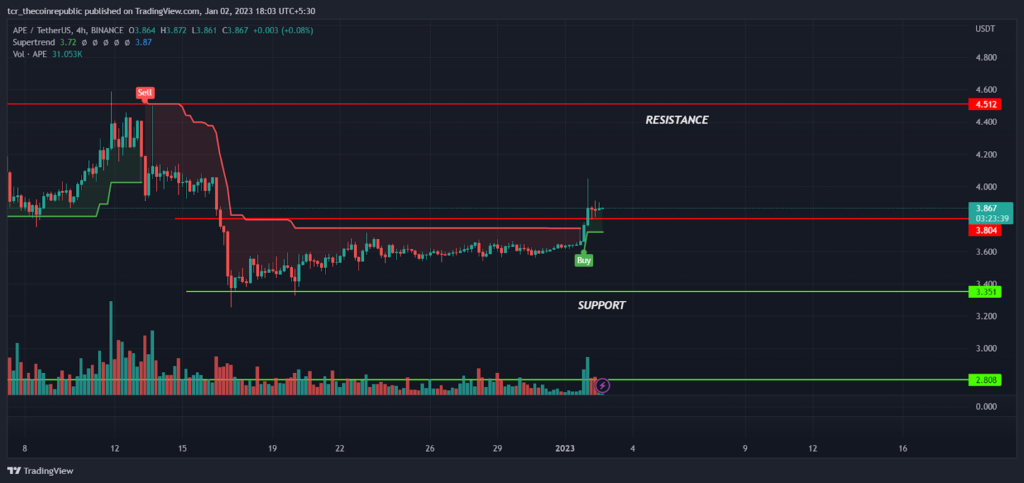
On a lower time frame, Apecoin prices are trading in the tight range between $3.351 to $3.804 and recently bulls attempted to break out of the higher range with a strong bullish candle indicating buyers were challenging the sellers on the resistance level.
The supertrend indicator had also generated a buy signal indicating the short term trend is reversing in the favor of bulls but the confirmation is still awaited.
Summary
Apecoin prices are in downtrend and forming lower low swings indicates sellers are active on higher levels but recently prices broke out 50 day EMA denotes buyers were trying to reverse the trend in the favor of bulls. As of now, aggressive traders might look for buying opportunities for the target of $4.500 and above, by keeping $3.350 as SL. However, If prices slipped below $3.350 bears may drag the prices further down towards $2.808 level.
Technical levels
Resistance levels : $4.512 and $5.256
Support levels : $3.351 and $2.808
Disclaimer
The views and opinions stated by the author, or any people named in this article, are for informational ideas only, and they do not establish financial, investment, or other advice. Investing in or trading crypto assets comes with a risk of financial loss.

Nancy J. Allen is a crypto enthusiast, with a major in macroeconomics and minor in business statistics. She believes that cryptocurrencies inspire people to be their own banks, and step aside from traditional monetary exchange systems. She is also intrigued by blockchain technology and its functioning. She frequently researches, and posts content on the top altcoins, their theoretical working principles and technical price predictions.


