
 Home
Home News
News

- XLM price hold the 50 day EMA at formed a bullish reversal pattern
- Stellar crypto price breakout previous month high at $0.0901 and formed a bullish engulfing candle
- XLM price races towards the supply zone but the technical indicators are turning bullish
XLM crypto price is trading with bullish cues bulls are trying to keep the prices above the 50 day EMA. The previous few sessions are in the favor of bulls and prices had breakout of the previous month high with a bullish engulfing candle indicating the confidence of buyers at lower levels. Currently, The pair of XLM/USDT is trading at $0.0912 with an intraday gains of 0.88% and the 24-hour volume to market cap ratio at 0.0375

XLM price is coming back to bullish track
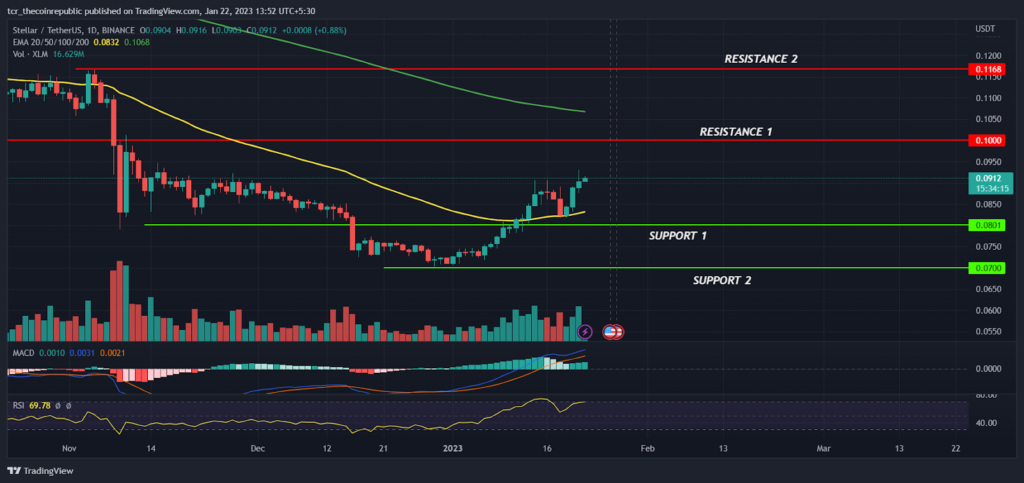
On a daily time frame, Stellar price is quite stable and rising upward with a slow momentum while forming higher high candles indicating the confidence of buyers at the lower levels. In the mid of December, XLM prices had broken down the important support level of $0.0800 with a giant bearish candle which has derived the negative sentiment in the market and prices hit a 52 week low at $0.0702 but luckily bears failed to drag the prices further down. After a little bit consolidation at lower levels, XLM prices reversed upward and showed signs of short term trend reversal in the favor of bulls.

XLM prices bounced back from the support levels and succeeded in holding the prices above the 50 day EMA indicating some genuine buyers have taken long positions and expecting the price to continue the upwards momentum. However, on the higher side $0.1000 will act as an immediate resistance for bulls followed by the next hurdle at $0.1168.
Stellar price is racing towards the supply zone but if market sentiment turns around then minor correction may also trigger from the supply zones. On the lower side, $0.0800 and $0.0700 will be acting as a savior for bulls. According to technical analysis, till the prices are above the 50 day EMA, the short term trend is in the favor of bulls and any rectracement towards support levels will be considered as a buying opportunity for the short term traders. The MACD had generated positive crossover indicating the strength of bulls and the RSI at 69 denotes prices are near to overbought levels.
Summary
Stellar crypto price has shown a slow and steady recovery from the lows which has gained the investors confidence and prices are showing signs of short term trend reversal in the favor of bulls.The technical analysis suggests that, Till prices hold the 50 day EMA, the probability of upside breakout increases and any short term corrections will be considered as a buying opportunity for the investors.Therefore, bullish traders may look for buy near to support levels and aim for the target $0.1100 and above by keeping $0.0.800 as SL
Technical levels
Resistance levels : $.1000 and $0.1168
Support levels : $0.0800 and $0.0700
Disclaimer
The views and opinions stated by the author, or any people named in this article, are for informational purposes only, and they do not establish financial, investment, or other advice. Investing in or trading crypto assets comes with a risk of financial loss.

Nancy J. Allen is a crypto enthusiast, with a major in macroeconomics and minor in business statistics. She believes that cryptocurrencies inspire people to be their own banks, and step aside from traditional monetary exchange systems. She is also intrigued by blockchain technology and its functioning. She frequently researches, and posts content on the top altcoins, their theoretical working principles and technical price predictions.


