
 Home
Home News
News

- Token bounces from the demand zone with strong bullish momentum.
- The pair of XRP/USDT is trading at the price level of $0.36 with a gain of 3.94% in the past 24 hours.
The downtrend in XRP has come to a halt, and it has been consolidating in a range for a long period of time. Bears were not allowed to push the token price below the demand zone by bulls. The token bounced after hitting the demand zone, which provided constant support.

XRP continues to trade above demand zone
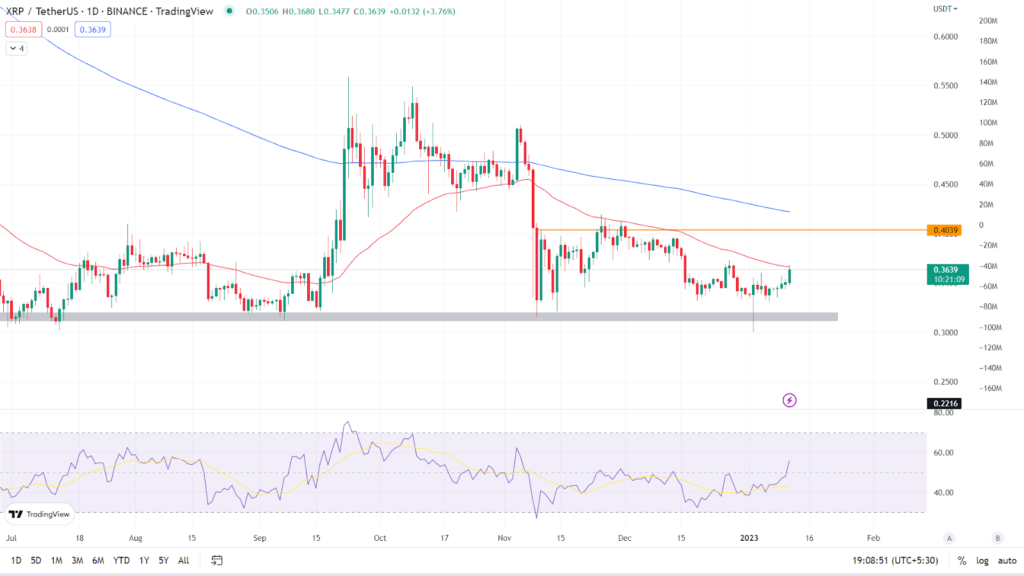
XRP recently made a long wick hitting the demand zone and bounced after hitting it. As shown on the daily chart. XRP is presently trading at $0.36, up 3.94% over the last 24 hours. It is now trading below its major Moving Averages (50 and 200 EMA). (Red line is 50 EMA and the blue line is 200 EMA). Token is constantly facing resistance at the 50 EMA, and it is now trading near the 50 EMA. Let’s see whether this time token can close above the 50-day moving average.

Relative Strength Index: The asset’s RSI curve is currently trading at 56.32 and is approaching the strong overbought zone over 70. The RSI curve has crossed above the 14 SMA, indicating bullishness. If the token closes above the 50 EMA and continues the bullish momentum, the value of the RSI curve will rise even further.
Analyst view & Expectations
Token is still trading inside its consolidation zone; if the token crosses over the 50 EMA and holds that level, it will break out of the consolidation zone and we may witness a short-term bullish trend. Investors are advised to wait for the candle to give closing above 50 EMA and then take trade if it sustains above it. However, intraday traders have a good opportunity to go short if the token fails to cross the 50 EMA and a strong bearish candle forms, or they may go long if the token closes above the 50 EMA.
According to our current XRP price prediction, the value of XRP will fall by -5.38% and hit $ 0.347788 in the coming days. Our technical indicators indicate that the current sentiment is Neutral, with the Fear & Greed Index reading 26. (Fear). Over the previous 30 days, XRP had 16/30 (53%) green days and 4.09% price volatility. According to our XRP forecast, now is a good time to buy XRP.
Technical Levels
Major support: $0.311
Major resistance: $0.403 and 50 EMA on daily time frame.
Conclusion
The token is trying to break out of its consolidation zone, and the RSI indicator is also indicating bullish strength. If the token can stay above the 50-day moving average, bulls may be able to continue their momentum.
Disclaimer: The views and opinions stated by the author, or any people named in this article, are for informational ideas only, and they do not establish the financial, investment, or other advice. Investing in or trading crypto assets comes with a risk of financial loss.

With a background in journalism, Ritika Sharma has worked with many reputed media firms focusing on general news such as politics and crime. She joined The Coin Republic as a reporter for crypto, and found a great passion for cryptocurrency, Web3, NFTs and other digital assets. She spends a lot of time researching and delving deeper into these concepts around the clock, and is a strong advocate for women in STEM.


