
 Home
Home News
News

- Micron stock price is stuck between the 50 day EMA and the 200 day EMA
- MU stock prices had formed a triple bottom pattern
- NASDAQ : MU stock price is up by 16.97% on monthly basis
Micron technology Inc (NASDAQ : MU) is trading with bullish cues and buyers are trying to hold the prices above the 50 day EMA. The previous few sessions are in the favor of bulls and if market sentiment remains positive then bullish momentum may in coming days. Currently, NASDAQ : MU stock price is trading at $58.46 with the intraday gains of 3.73% and market cap stood at $63.79B

Will MU stock be able to outperform in 2023 ?
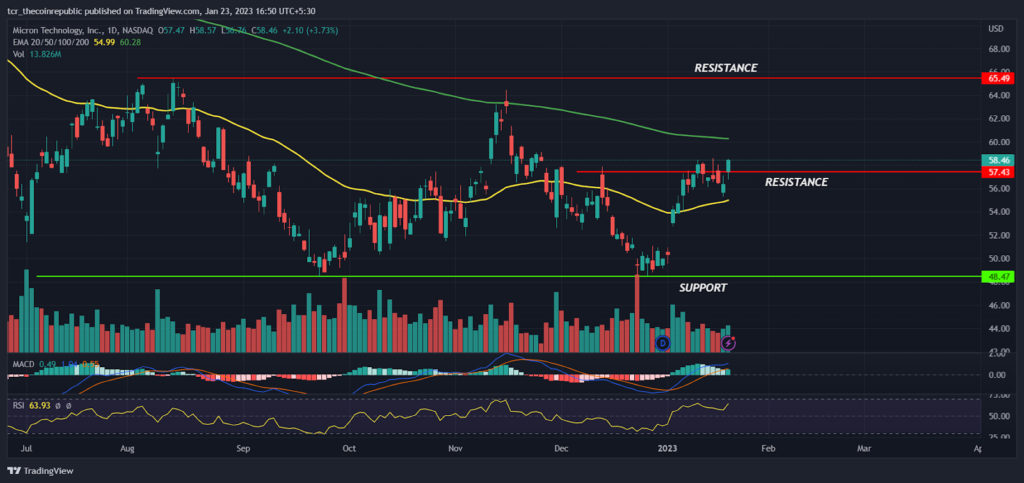
On a daily time frame, MU stock prices are reversing upward with the positive momentum and bulls have succeeded to break out of the swing high hurdle at $57.53.

From the past 6 months, MU stock prices are stuck in the wide range between $48 to $65 and investors have not generated any wealth over this time. In the past, bulls have tried multiple times to break out of the 50 day EMA but unfortunately prices unable to hold the higher levels indicates the bear dominance but recently prices formed triple bottom and bounced back shapely which has created a hope of long term investors.
Micron technology Inc, financials are degrading and the operating cash flow positions are not stable which shows the company is going through the tuff phase and demand for chips is slowing down. According to the data in Yahoo finance, Average revenue estimate given by 23 analysts for the current quarter (Feb 2023) is at $39.79B and for the next quarter(May 2023) at $3.99B.
MU stock technicals are turning bullish but prices are near the supply zone and mild negative news can again trigger the selling from the higher levels. However,Till prices are trading above the 50 day EMA short term selling will be used as a buying opportunity for the traders. On the lower side, $48 is acting as a long term demand zone for bulls. The MACD has generated a positive crossover indicating bullishness may continue for the coming days and the RSI at 63 sloping upwards denotes the strength of bulls.
Summary
MU stock is reversing upwards by forming a triple bottom bullish pattern but the prices are near the supply zones and it will be difficult for bulls to dominate on the higher levels. The technical analysis suggests that, till prices hold above the 50 day EMA, minor dips will provide a buying opportunity and traders may aim for the target of $65.00 by keeping $52.00 as SL. However, if prices drop below $48.00 the demand zone will be in the bear’s grip.
Technical levels
Resistance levels : $62.00 and $65.00
Support levels : $52.00 and $48.00
Disclaimer
The views and opinions stated by the author, or any people named in this article, are for informational ideas only, and they do not establish financial, investment, or other advice. Investing in or trading crypto assets comes with a risk of financial loss.

Nancy J. Allen is a crypto enthusiast, with a major in macroeconomics and minor in business statistics. She believes that cryptocurrencies inspire people to be their own banks, and step aside from traditional monetary exchange systems. She is also intrigued by blockchain technology and its functioning. She frequently researches, and posts content on the top altcoins, their theoretical working principles and technical price predictions.


