
 Home
Home News
News

- Polkadot price shown a V-shape recovery and succeeded to breakout of the downward sloping trendline
- DOT crypto price reclaimed 50 day EMA and approaching 200 day EMA
- DOT price formed bullish engulfing candle and up by 53% on the monthly basis
The Polkadot prices are trading with mild bearish cues and bear’s are trying to reject the prices from the supply zones by forming a long tail bearish candle. Currently, DOT/USDT is trading at $6.555 with an intraday loss of 0.08% and the 24-hour volume to market cap ratio at 0.0638

Polkadot price needs short term correction
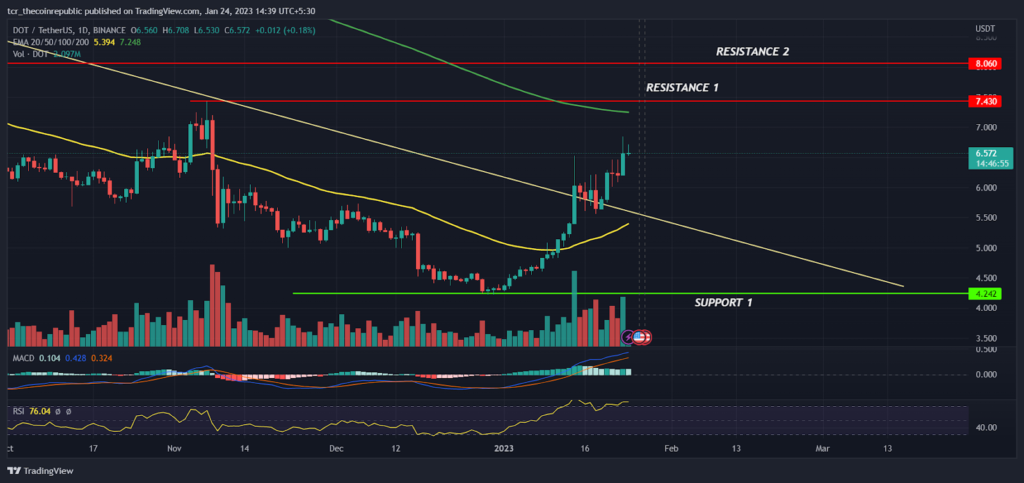
On a daily time frame, The Polkadot price showed a V- shape recovery and formed a bullish reversal pattern. The buyers succeeded to break out of the down sloping trendline which indicates that the short term trend has reversed in the favor of bulls but prices seem to be lacking momentum near the supply zones and likely to consolidate for some time.

The DOT coin prices are approaching the 200 day EMA which will act as immediate resistance for bulls followed by next resistance at $7.430 and $8.060 level. If bulls succeed to break out of the hurdle zones then we can say that the positional trend is reversed and buyers have taken the dominance on the supply levels. According to price action, DOT coin had struggled a lot to sustain above the downward sloping trendline which indicates that bears are active at higher levels and it will be difficult for bulls to prove its dominance near the supply zones.
The DOT coin prices had also witnessed a spike in the volumes which is favoring the bulls but technical indicators show that prices are lacking momentum and DOT coin may see minor selloff from the supply zones. However, the probability of bouncing back from the support level of $5.500 and $4.500 is high, due to its credibility in the crypto market. The MACD had generated a positive crossover and RSI at 75 denotes the strength of bulls.
Summary
The Polkadot prices are on rise and succeeded in breakout of the downward sloping trendline which shows the confidence of buyers but prices are near to the supply zones and may face minor selloff in the coming weeks. According to technical analysis, DOT prices are in bull’s grip and the probability of upside breakout is high as compared to downside. Therefore, it’s better to sit in cash and wait for 50 EMA retracement to build long positions.
Technical levels
Resistance levels : $7.450 and $8.060
Support levels : $5.500 and $4.500
Disclaimer
The views and opinions stated by the author, or any people named in this article, are for informational purposes only, and they do not establish financial, investment, or other advice. Investing in or trading crypto assets comes with a risk of financial loss.

Andrew is a blockchain developer who developed his interest in cryptocurrencies while pursuing his post-graduation major in blockchain development. He is a keen observer of details and shares his passion for writing, along with coding. His backend knowledge about blockchain helps him give a unique perspective to his writing skills, and a reliable craft at explaining the concepts such as blockchain programming, languages and token minting. He also frequently shares technical details and performance indicators of ICOs and IDOs.


