
 Home
Home News
News

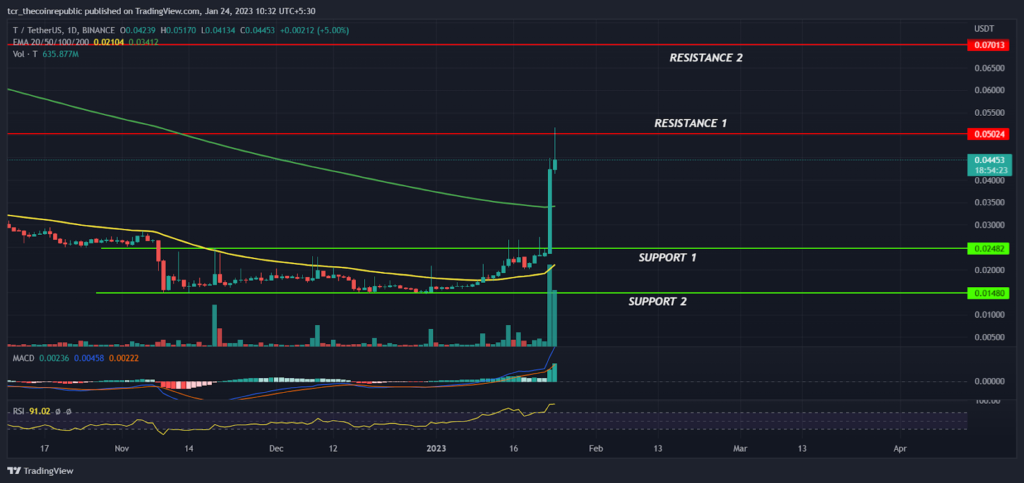
- Threshold token price reclaimed the 50 and 200 day EMA and formed a reversal pattern
- T token price entered in top 100 coinmarket cap list which has grabbed the investors attention
- T token price broke out from the narrow range consolidation
Threshold crypto price is trading with bullish cues and bulls are trying to hold the prices above the 50 and 200 day EMA to show its presence on the lower levels. However, the sustainability of the recent up-move is doubtful. Currently, The pair of T/USDT is trading at $0.04519 with an intraday gains of 6.79% and the 24-hour volume to market cap ratio at 2.1013

Is the Threshold Token price Up-move fake or real ?
On a daily time frame, Threshold token price had shown a massive up-move and formed a giant bullish reversal candle which has created a hope for bullish traders.

From the past couple of months, Threshold token prices are stuck in the narrow range between $0.01480 to $0.02482 and struggles to hold the 50 day EMA indicates the bear dominance but surprisingly In the mid of January, some aggressive buyers came forward and succeeded to break the higher range which has triggered the positive sentiment and prices continued the upward momentum.
Threshold crypto has also witnessed a massive spike in the buying volume and price shot up in same direction indicating some big whales have taken long positions and expecting the prices to hold the current levels but the confirmation will come when prices will be able to sustain above the 50 day and 200 day EMA in the coming months. However, prices are facing immediate resistance at $0.05024 and if bulls succeeded to break out of the immediate hurdle then prices might rally towards the $0.07013 level.
Threshold token has entered into the top 100 CMC list which has grabbed the investors attention but we should be careful and wait for the confirmation for the sustainability of the breakout else, the token might also become a victim of pump and dump cryptos.
However, According to the price action, the breakout looks genuine and any dips towards 50 and 200 day EMA will be taken as buying opportunities. On the lower side, $0.02482 will act as support level for bulls and if prices drop below the support level then the up move will be considered as a trap.
Summary
Threshold token prices are on the recovery mode and witnessed a wild spike in the prices which shows the initial signs of bullish trend reversal but the confirmation will come when prices will hold the EMA’s in the coming months. Technical analysis suggests that the recent up-move looks real and any dips towards the 50 EMA will provide buying opportunities for the investors.
Therefore, Aggressive traders might take the risk and look for buying opportunities near to support levels for the target of $0.07013 and above by keeping $0.02000 as SL. However, if the price drops below the $0.02482 the trend reversal will become doubtful.
Technical levels
Resistance levels : $0.05024 and $0.07013
Support levels : $0.02482 and $0.01480
Disclaimer
The views and opinions stated by the author, or any people named in this article, are for informational purposes only, and they do not establish financial, investment, or other advice. Investing in or trading crypto assets comes with a risk of financial loss.
Steve Anderson is an Australian crypto enthusiast. He is a specialist in management and trading for over 5 years. Steve has worked as a crypto trader, he loves learning about decentralisation, understanding the true potential of the blockchain.


