
 Home
Home News
News

- The token is consolidating in a range on the daily time frame.
- TWT token has bounced off the demand zone.
The Trust Wallet (TWT) token has reached an all-time high of $2.74 on December 11th, 2022. Since then, the token has been declining and is currently consolidating in a zone on the daily time frame between the 50 EMA and the 200 EMA.

TWT on the daily chart
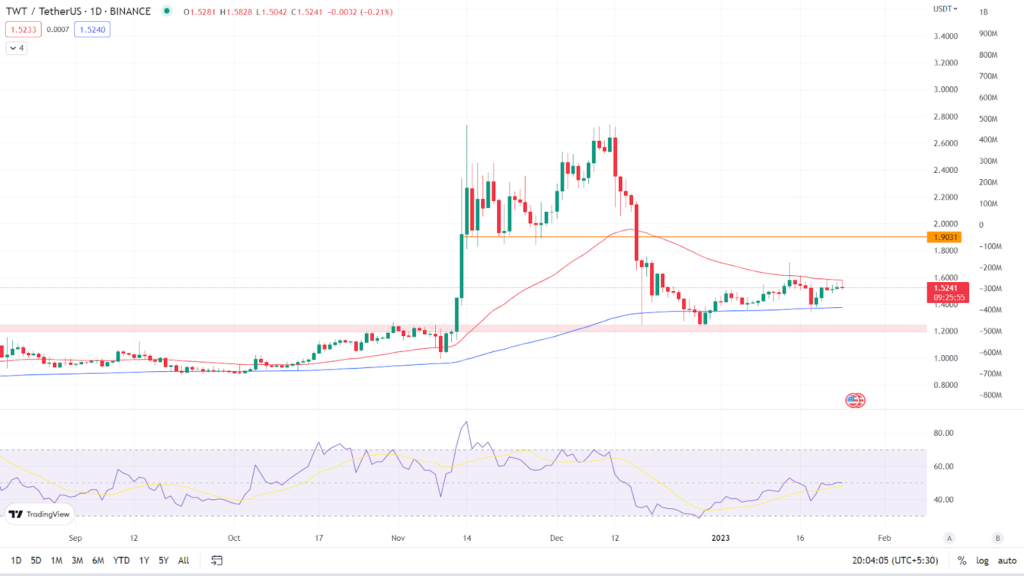
The token bounced off the demand zone with strong bullish momentum, however the bulls were unable to continue the momentum. TWT token is currently trading at $1.52, 45% down from it’s all-time high, as shown on the daily chart. It is trading between its two key Moving Averages, the 50 EMA and the 200 EMA. (Red line is 50 EMA and the blue line is 200 EMA). For the past few days, it has been trading in a range.

Relative Strength Index: The asset’s RSI curve is currently trading at 49.88, slightly below the halfway point of 50. As the token is consolidating in a range, there is no such big moment in the RSI indicator. The RSI curve has crossed above the 14 SMA. If the token is able to break out of the consolidation zone and go upward, the RSI value will rise and may enter the overbought zone.
Analyst view & Expectations
On the daily time frame, the token is being rejected by the 50 EMA, and we can see that the body of the candle is very small and the wick is longer. Investors are advised to wait for the token to break out of the consolidation before buying to gain more insight on the trend’s direction. Intraday traders, on the other hand, have a good opportunity to trade in the direction of the breakout and book profits based on their risk to reward ratio.
According to our current Trust Wallet Token price prediction, the value of Trust Wallet Token is expected to fall by -8.19% in the coming days and reach $ 1.404543. Our technical indicators indicate that the current sentiment is bullish, with the Fear & Greed Index reading 52. (Neutral). Over the previous 30 days, Trust Wallet Token had 14/30 (47%) green days and 5.09% price volatility. According to our Trust Wallet Token forecast, now is not the time to buy Trust Wallet Token.
Technical Levels
Major support: $1.35 & $1.19
Major resistance: $1.57 & $1.90
Conclusion
The token showed signs of bullish momentum before coming to a halt and consolidating in a range. It remains to be seen whether the bulls can continue their momentum and make an upward breakout of the range. Investors should wait for a clear indication before acting.
Disclaimer: The views and opinions stated by the author, or any people named in this article, are for informational ideas only, and they do not establish the financial, investment, or other advice. Investing in or trading crypto assets comes with a risk of financial loss.
Steve Anderson is an Australian crypto enthusiast. He is a specialist in management and trading for over 5 years. Steve has worked as a crypto trader, he loves learning about decentralisation, understanding the true potential of the blockchain.


