
 Home
Home News
News

- The token has shown bullish actions in the previous sessions.
- LRC token is trading below the demand zone on the daily time frame.
Cryptocurrencies have grabbed the attention of investors worldwide, and there are literally dozens of different cryptocurrencies to choose from. With so many alternatives, it might be difficult to choose which cryptocurrencies to invest in. Is LRC among them? Let’s figure it out together! Today we will look into the LRC token.

LRC token on the daily chart
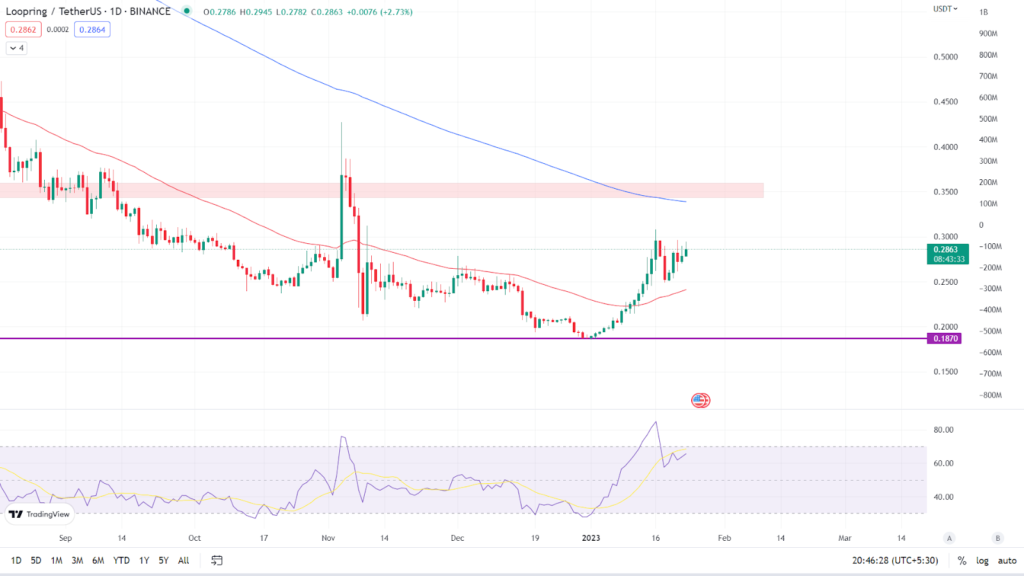
With strong bullish momentum, the token bounced off the $0.1870 support level, crossed the 50 EMA, and has sustained above it. According to the daily chart, LRC token is currently trading at $0.2863, up 3.38% in the last 24 hours. It is trading between its two key moving averages, the 50 and 200 EMA. (Red line is 50 EMA and the blue line is 200 EMA). Bulls are in command of the trend forming strong bearish candles on the daily time frame.

Relative Strength Index: The asset’s RSI curve is currently trading at 66.40, indicating that it is in the overbought zone. The recent increase in the price of the token has increased the value of the RSI curve. The RSI curve remains below the 14 SMA. If the bullish momentum continues in the following days, the RSI curve will cross above the 14 SMA, indicating bullishness.
Analyst view & Expectations
The bulls are in command of the trend, driving up the price of the token and maximizing the returns of current investors. Investors who like to take risks can buy now and aim for $0.3431 as a short-term target, while those who like to trade safely can wait for the token to break above and sustain above the $0.3599 resistance level to get more confirmation on the trend. Intraday traders, on the other hand, have a good opportunity to go long and book profits based on their risk to reward ratio.
According to our current Loopring (LRC) price forecast, the price of Loopring (LRC) is expected to fall by -4.76% and reach $ 0.277961 in the next few days. Our technical indicators indicate that the current sentiment is Neutral, with the Fear & Greed Index reading 50. (Neutral). Over the previous 30 days, Loopring had 21/30 (70%) green days and 14.59% price volatility. According to our Loopring forecast, now is a good time to buy Loopring.
Technical Levels
Major support: $0.2487
Major resistance: $0.3599
Conclusion
In the daily time frame, the token has crossed the 50 EMA and has sustained above it. Investors can invest now by managing their risk. Let’s see whether the bulls can break through the $0.3599 resistance level.
Disclaimer: The views and opinions stated by the author, or any people named in this article, are for informational ideas only, and they do not establish the financial, investment, or other advice. Investing in or trading crypto assets comes with a risk of financial loss.

Andrew is a blockchain developer who developed his interest in cryptocurrencies while pursuing his post-graduation major in blockchain development. He is a keen observer of details and shares his passion for writing, along with coding. His backend knowledge about blockchain helps him give a unique perspective to his writing skills, and a reliable craft at explaining the concepts such as blockchain programming, languages and token minting. He also frequently shares technical details and performance indicators of ICOs and IDOs.


