
 Home
Home News
News

- Fisker Inc. FSR Stock Price has been constant inside a horizontal range-bound area over the daily time frame chart.
- FSR share price needs to reverse the current trend as sellers have been raiding FRS stocks from the start of day’s trading session.
- FSR share price has slipped below 20, 50, 100 and 200-days Daily Moving Average.
FSR stock price needs to skip its consolidation phase and must soar breaking out of the horizontal range. FSR share price has been consolidating since November 2022 over the daily time frame chart. Fisker Inc stocks need to gain support from buyers in order to revert the current trend. FSR investors need to wait for any directional change over the daily chart.

FSR stock price was at $6.72 and has dropped around 2.96% of its market capitalization during the day’s trading session. Trading volume can be seen below average but under full control of sellers.

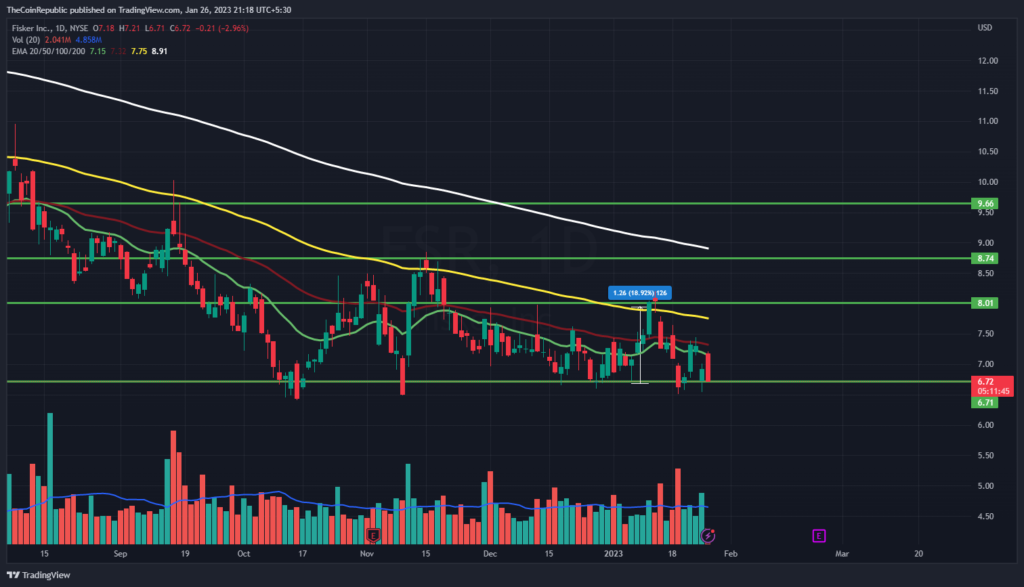
FSR stock needs to attract more buyers in order to sustain at the lower level of the consolidation phase. Meanwhile, volume change can be seen below average and needs to grow in favor of buyers. However, FSR share price has slipped below 20, 50, 100 and 200-days Daily Moving Average. Support at the lower end is at 6.50 and resistance on the upper side is at $7.20.
Technical Indicators do Signify FSR Stock Price Downtrend
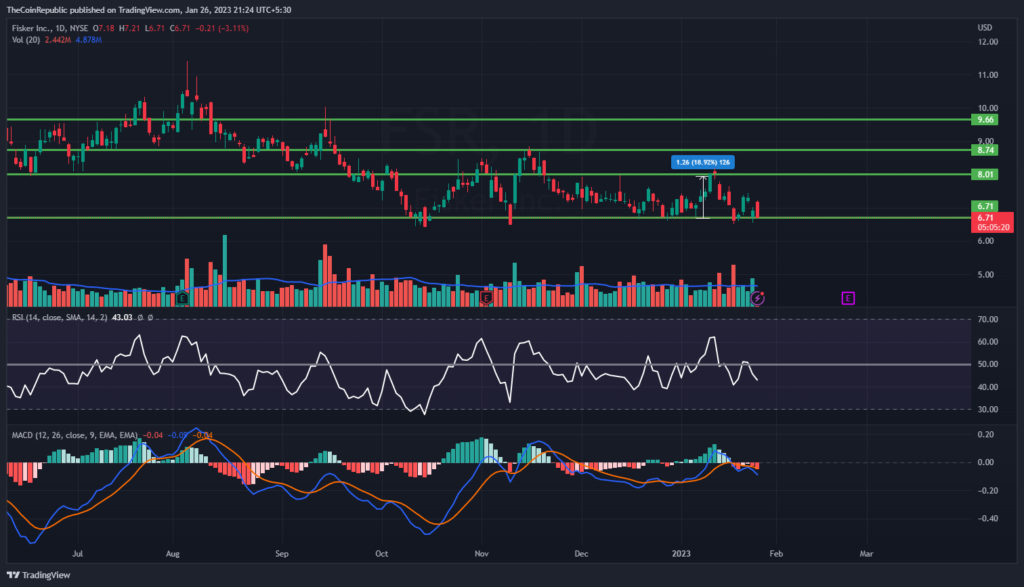
Technical indicators suggest the downtrend momentum of FSR share price. Relative Strength Index showcases the downtrend momentum of FSR shares. RSI is at 42 and is heading towards oversold territory. MACD exhibits the downside momentum of FSR shares. The MACD line is below the signal line after a negative crossover. FSR investors need to wait for any directional change over the daily chart.
Summary
FSR stock price needs to skip its consolidation phase and must soar breaking out of the horizontal range. FSR share price has been consolidating since November 2022 over the daily time frame chart. However, FSR share price has slipped below 20, 50, 100 and 200-days Daily Moving Average. Technical indicators suggest the downtrend momentum of FSR share price.
Technical Levels
Support Levels: $6.50 and $6.00
Resistance Levels: $7.20 and $8.40
Disclaimer
The views and opinions stated by the author, or any people named in this article, are for informational ideas only, and they do not establish financial, investment, or other advice. Investing in or trading crypto assets comes with a risk of financial loss.

Andrew is a blockchain developer who developed his interest in cryptocurrencies while pursuing his post-graduation major in blockchain development. He is a keen observer of details and shares his passion for writing, along with coding. His backend knowledge about blockchain helps him give a unique perspective to his writing skills, and a reliable craft at explaining the concepts such as blockchain programming, languages and token minting. He also frequently shares technical details and performance indicators of ICOs and IDOs.


